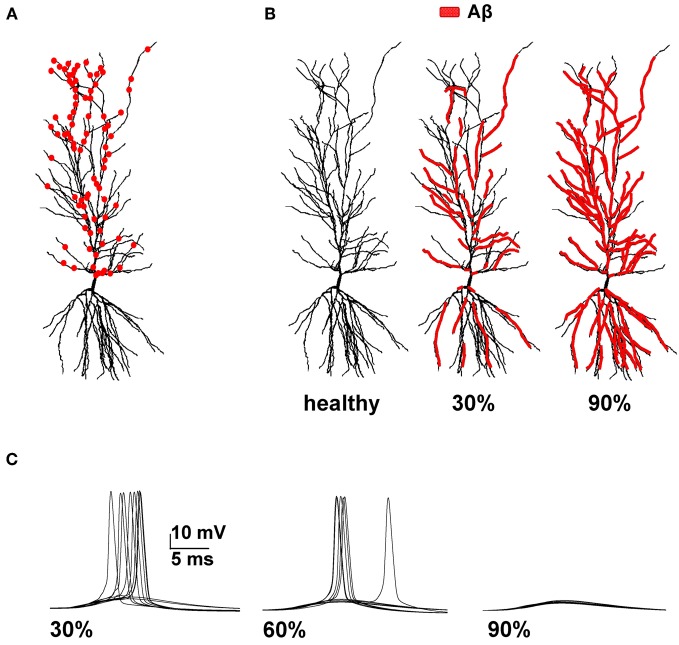
Figure 1.
Model setup. (A) Schematic representation of the hippocampal CA1 pyramidal neuron used in all simulations (cell 5038804 in the neurophorpho.org public archive). Red circles represent a typical distribution of the 100 excitatory synapses, randomly redistributed and activated during each simulation, used to calculate the average spike probability; (B) Aβ-peptides progressive accumulation was modeled by modifying the intrinsic active and synaptic properties of increasing membrane area; the panels represent the control conditions (left, healthy) and typical cases where 30% (middle) or 90% (right) of membrane was affected by Aβ. (C) Typical somatic membrane potential at three different stages of disease (30–60–90% of impaired membrane area) during activations of synaptic inputs (1.20 nS). Traces show the results for 10 different simulations using a random redistribution of synaptic locations, affected dendrites and synaptic activation times. Note the lower number of spikes (i.e., lower spike probability) as the membrane area affected by Aβ increases.

