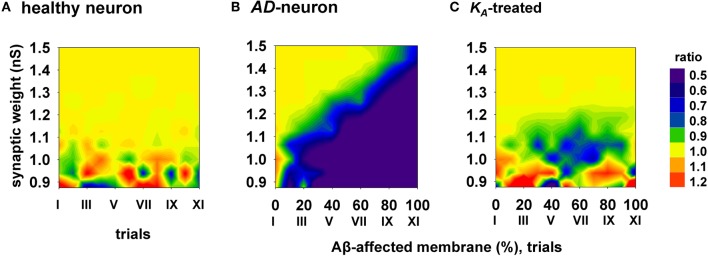
Figure 6.
Overall improvement of a KA-treatment. All contour plots show, for each condition of synaptic weight and % of impaired surface, the ratio between the average value of spike probability and its value under control conditions (i.e., healthy neuron); healthy condition is represented by a ratio around 1. (A) average ratio for 11 trials (differing each other for redistribution of damaged neuronal area, synapses location and activation time) under healthy conditions; (B) the ratio is decreased by AD, with a stronger effect for higher portion of damaged membrane; (C) after KA-treatment, the ratio is restored to a value around 1 (healthy conditions) for a wide range of parameters.

