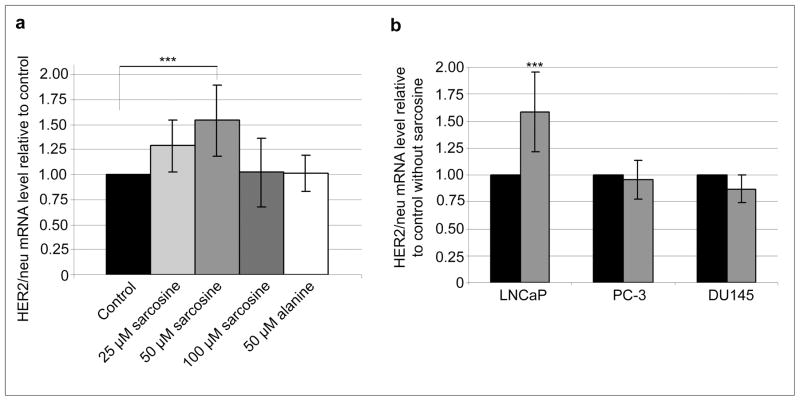
Fig. 1.
Effect of sarcosine on relative HER2/neu mRNA levels in prostate cancer cells. (a) Exposure of LNCaP cells to 25–100 μM sarcosine or 50 μM alanine for 24 h; (b) exposure of androgen-dependent (LNCaP) and androgen-independent (PC-3 and DU145) to 50 μM sarcosine for 24 h. Black, grey and white bars represent control experiments without addition of sarcosine, sarcosine and alanine experiments, respectively. Mean values of at least three independent experiments are shown. Error bars show SD and the asterisks indicate significant fold change (P < 0.001, as determined by the student’s t-test)

