Figure 2.

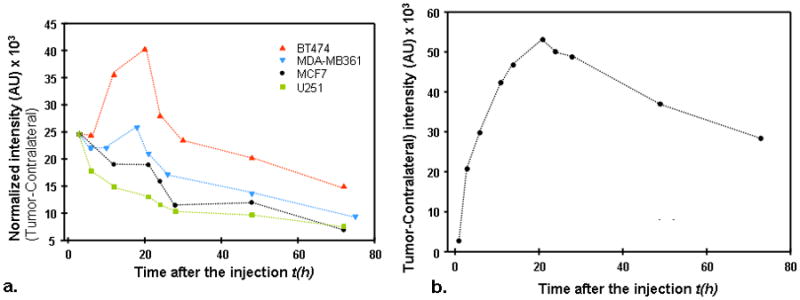
Figure 2a. Difference between normalized tumor–contralateral data, as a function of time, for four tumor types, differing in HER2 expression.
b. Difference between normalized tumor–contralateral data (BT474 xenograft), measured at shorter time intervals in the first 25 hours for one of the mice in the second series of measurements.
