Figure 4.
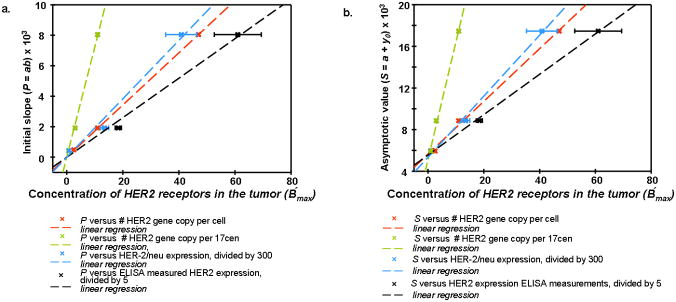
Figure 4a. Correlation between parameter P=ab (intial slope) in the Exponential Regression and quantitative characteristics of amplification and overexpression of HER2 for breast carcinoma cell lines MCF7, MDA-MB361, BT474.
b. Correlation between parameter S=y0+a (asymptotic intensity) in the Exponential Regression and quantitative characteristics of amplification and overexpression of HER2 for breast carcinoma cell lines MCF7, MDA-MB361, BT474.

