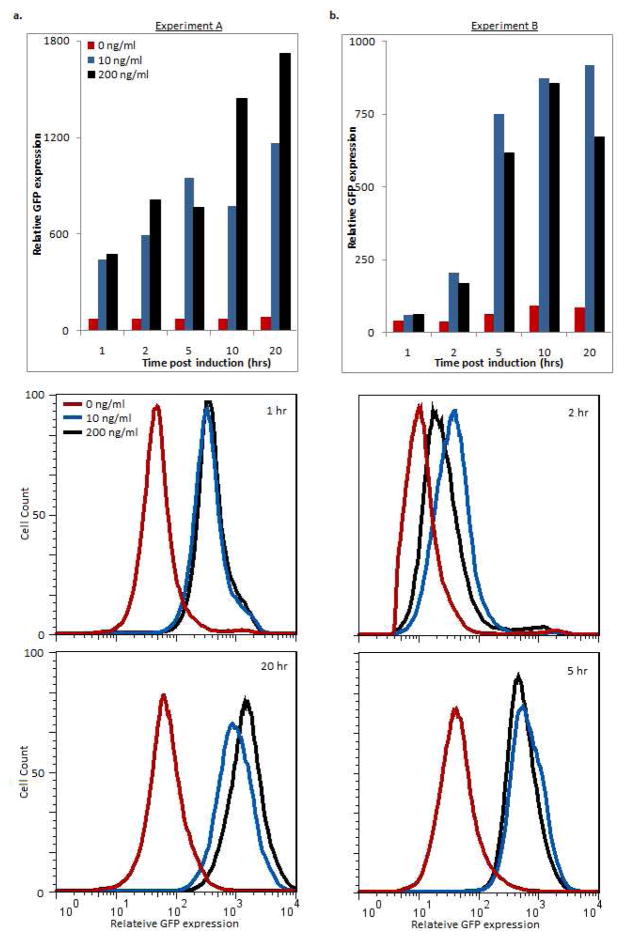
Figure 3. proTeOn system phenotype analysis by flow cytometry.
Mean GFP expression and expression distribution were analyzed by flow cytometry 1, 2, 5, 10, and 20 hours post-treatment for both experimental set-ups as described. Induction experiments were repeated for all inducer concentrations and time points, and the reported trends were observed across replicates.
a. Cells expressing PROTEON were induced with 0, 10 and 200 ng/ml aTc. By one hour after aTc treatment, proTeOn upregulates GFP expression. Steady state expression is reached by 5 hours and 10 hours with low and high aTc concentrations (respectively) and maintained through 20 hours. Maximum overexpression is 10 and 15-fold above uninduced controls with low and high aTc levels respectively.
b. PROTEON was expressed in cells pre-cultured with 0, 10 and 200 ng/ml aTc. In low and high aTc, significant proTeOn activity is observed 2 hours after PROTEON expression is induced. Steady state activity is achieved by 5 hours and maintained through 20 hours. Maximum upregulation is 10–fold above uninduced controls with both aTc concentrations

