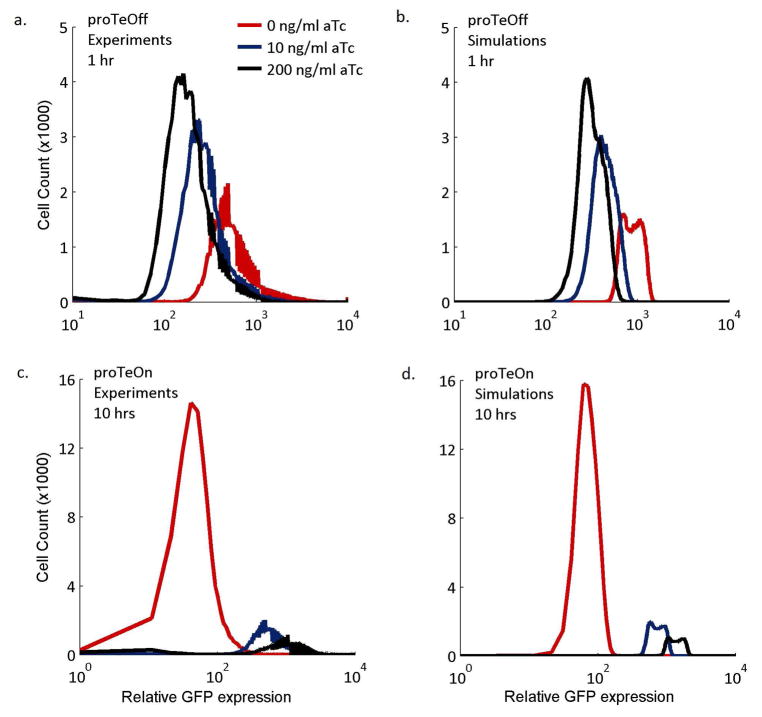
Figure 6. proTeOn and proTeOff GFP distribution by stochastic simulations.
Simulation (Figures 6b, 6d) and experimental (Figures 6a, 6c) results of the distribution of GFP expression throughout the cell population when 0, 10 and 200 ng/ml aTc are administered. The simulation results largely agree with the experimental phenotypes.
a, b. proTeOff GFP distribution at 1 hour.
c, d. proTeOn GFP distribution at 10 hours.

