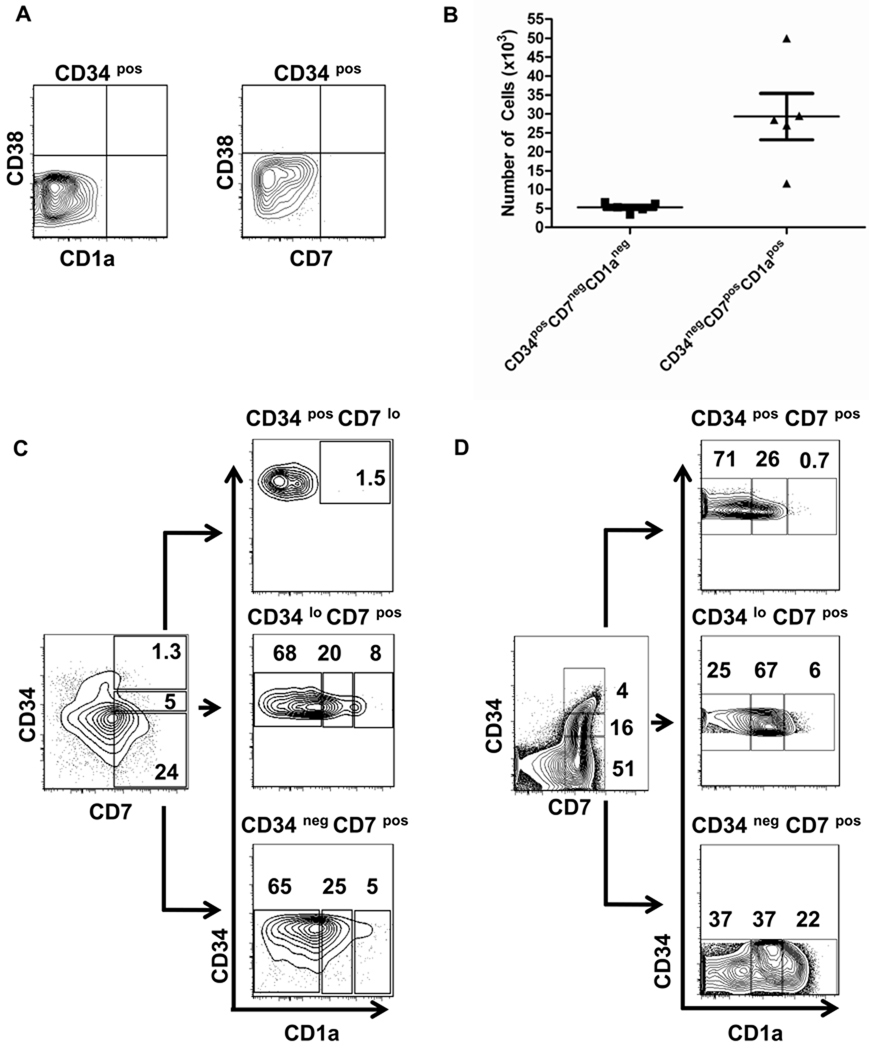
Figure 2. Expansion of CB HPCs and expression of T lineage surface markers on CB HPCs after co-culture with TEC-Dl1.
(A) Lack of CD38 (APC), CD7 (biotin + SA-APC-Cy7) and CD1a (biotin + SA-APC-Cy7) expression on enriched CD34pos CB cells before culture; (B) CB HPCs (3000 cells) were co-cultured with TEC-Dl1 for two weeks; the total number of CD34posCD7negCD1aneg cells uncommitted to the T cell lineage (n=5) and the total number of CD34negCD7posCD1apos cells committed to the T cell lineage (n=5) was determined. The bars indicate the means ± S.D.; C and D) CD1a expression within the CD34posCD7lo, CD34loCD7pos, and CD34negCD7pos subsets generated from CB HPC-TEC-Dl1 co-cultures (C) or cryopreserved ex vivo pediatric human thymocytes (D) as determined by flow cytometry. Numbers shown are percentages. These data are representative of five CB HPC cultures and thymocytes from three human thymi. The scale for each axis is log10 fluorescence.

