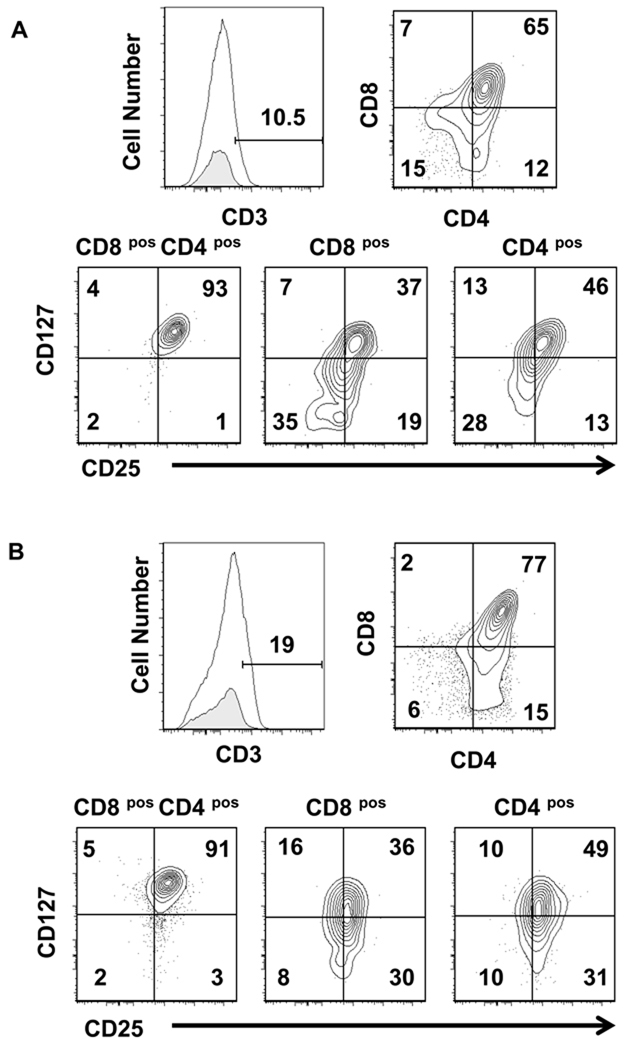
Figure 4. Expression of CD25 and CD127 within CD3lo CD4posCD8pos double positive and CD4pos or CD8pos single positive populations.
(A) Cells were harvested from CB HPC-TEC-Dl1 co-cultures after two weeks and cell surface phenotype was analyzed by flow cytometry. The CD3lo cell population was determined by comparing cells stained with APC anti-CD3 (unshaded, top left panels) with an APC conjugated antibody that does not bind T cells (shaded, top left panels). The percentage of CD3lo cells is indicated. CD3lo cells were divided into subsets based on expression of CD4 (AF750) and CD8 (PECy7) (top right panels). These subsets were then analyzed for the expression of CD25 (PE) and CD127 (PECy5) (bottom panels). Numbers shown above markers or within quadrants are percentages. (B) Similar analyses were performed for BM HPC-TEC-Dl1 co-cultures. Representative data of five independent CB HPC co-culture and two independent BM HPC co-culture experiments are shown. Axes show log10 fluorescence.

