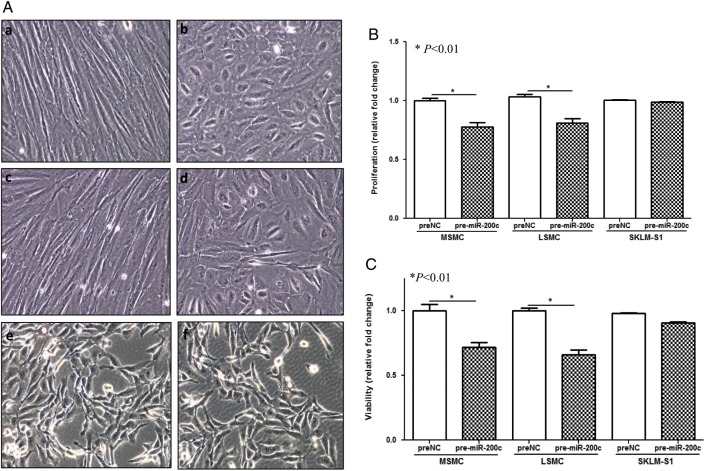
Figure 3.
(A) Photomicrographs showing the morphological appearance of MSMC (a and b), LSMC (c and d), and SKLM-S1 (e and f) following gain-of-function of miR-200c (b, d and f) as compared with control (preNC) (a, c and e) for 96 h. The influence of miR-200c and corresponding control (preNC) on cell proliferation (B) and cellular viability (C) were determined by crystal violet and MTT assay after 4 days of incubation with culture media changed every 2 days. The assays were performed using three to five sets of independent cell preparation and the results were presented as mean±s.e.m. and analyzed by nonparametric Student's t-test with P values shown as corresponding lines. A full colour version of this figure is available via http://dx.doi.org/10.1530/ERC-12-0007.

