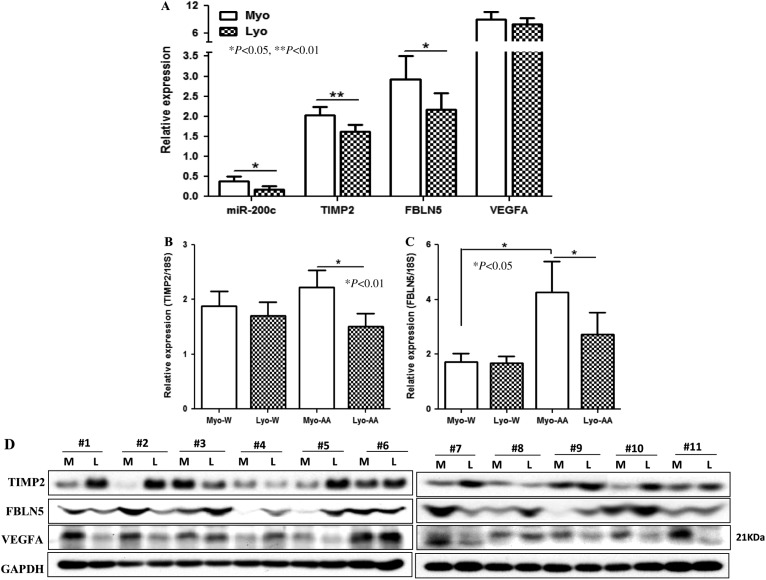
Figure 6.
Relative (mean±s.e.m.) expression of miR-200c, TIMP2, FBLN5, and VFGFA (A) in LYO and matched MYO from untreated including follicular (n=12) and luteal (n=19) phases of the menstrual cycle and women experiencing AUB (n=12). (B) TIMP2 and (C) FBLN5 expression of untreated group based on ethnicity in Caucasians (W, n=23) and African Americans (AA, n=17). (D) Western blot analysis shows the expression of TIMP2, FBLN5, and VEGFA of tissue extracts from 11 leiomyomas (L) and paired myometrium (M) from untreated groups. GAPDH was used as loading control. The mean values were analyzed using nonparametric t-test with P values indicated by corresponding lines for each group.

