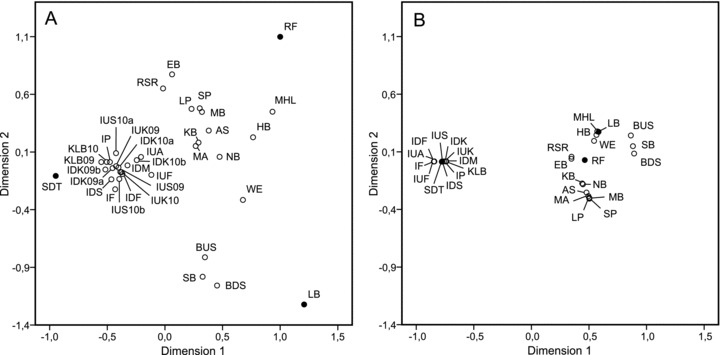
Figure 5.

Nonmetric multidimensional scaling plots based on genetic (A) (pairwise FST) and geographic (B) (waterline km) distance of populations from the Ems catchment area. Note: (1) Populations RF, SDT, and LB (filled circles) are outliers in the genetic differentiation plot (A), but centred in the geographic distance plot (B). (2) Geographically closely neighboring populations (e.g., AS–MA, LP–MB, RSR–EB) are genetically distinct. (3) In the Ibbenbürener Aa cluster, with significant saltwater influence (Fig. 1E), consecutive samplings from same locations may have relatively high genetic differentiation (e.g., IUS10a–IUS10b, IDK10a–IDK10b; compare Table A1). For abbreviations of sampling sites see Table 1.
