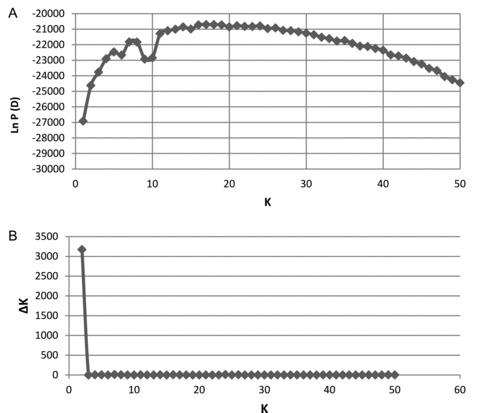
Figure A1.

Distribution of first- and second-order likelihood values of the cluster analysis with STRUCTURE. The K-values represent the numbers of clusters tested. (A) The Ln P (D) demonstrates the average value of 20 runs with 106 iterations each after a burn-in phase of 2.5 × 10⁵ iterations. (B) The second-order likelihood values are given by ΔK, measured according to Evanno et al. (2005).
