
Figure 4.
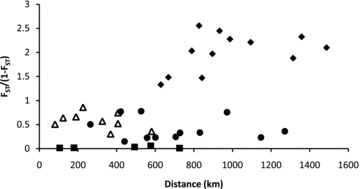
Graph illustrating the relationship between geographic and genetic distance using mitochondrial DNA sequence data for each pair of sampling localities (all pairs: r= 0.65, P= 0.001). This relationship is not significant between adjacent regions (eastern/central = filled circles, r= 0.37, P= 0.08; western/central = open triangles, r= 0.22, P= 0.12) but is significant between eastern and western sampling localities (filled diamonds, r= 0.83, P= 0.01). Within-region comparisons (filled squares) had the lowest values of genetic distance, despite having geographic distances overlapping those of all other across-region comparisons.