
Figure 5.
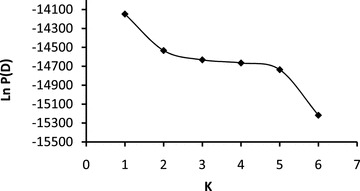
Graph illustrating the log posterior probabilities of the micro-satellite data (Ln P(D)) for each number of genetic groups (K) tested. Maximum value of Ln P(D) corresponds to K= 1 indicating data represent a single population.
Official websites use .gov
A
.gov website belongs to an official
government organization in the United States.
Secure .gov websites use HTTPS
A lock (
) or https:// means you've safely
connected to the .gov website. Share sensitive
information only on official, secure websites.
Graph illustrating the log posterior probabilities of the micro-satellite data (Ln P(D)) for each number of genetic groups (K) tested. Maximum value of Ln P(D) corresponds to K= 1 indicating data represent a single population.