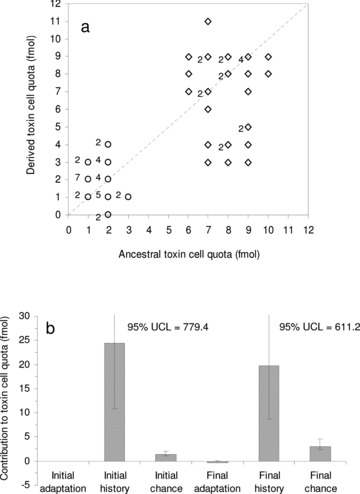
Figure 4.

(a) Ancestral versus derived values for mean toxin cell quota measurements in 10 isolates from the strains AL1V (diamonds) and AL2V (circles) of Alexandrium minutum. Derived values were obtained after 720 days (ca. 250 and ca. 180 generations in strains AL1V and AL2V, respectively). Digits close to symbols indicate the number of similar scores. Isocline (dotted line) represents the score location if no changes take place. (b) Contributions of adaptation, chance, and history to toxin cell quota at the start and at the end of the experiment. Error bars represent 95% confidence limits; values of the upper confidence limits (UCL) for history are included.
