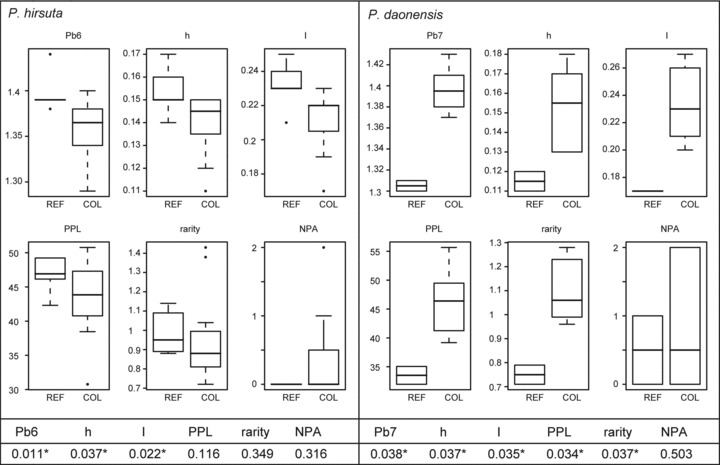
Figure 4.

Boxplots of various genetic indices of Primula hirsuta and P.daonensis comparing populations situated in glacial refugia (“REF”: P. hirsuta: GRA, GRU, OLAb, SBE, SEL; P. daonensis: LCA, PED) and colonized areas (“COL”: P. hirsuta: ARC, BER, GAL, GAUa, GAUb, GRI, LAU, TIR1, TIR2, TIR3, ZEI, VAL; P. daonensis: GAVa, MURc, SCO, STE, VIVa, VIVb) as identified by distribution modeling. Pb, band richness with rarefaction sample size six for P. hirsuta and seven for P. daonensis; h, Nei's gene diversity; I, Shannon index; PPL, percentage of polymorphic loci; NPA, number of private alleles. Whiskers extend to the most extreme data point within the interquartile range from the box. P-values from one-tailed randomization tests using 10,000 Monte Carlo iterations comparing the two groups are given below the boxplots, significant differences are marked with an asterisk (*).
