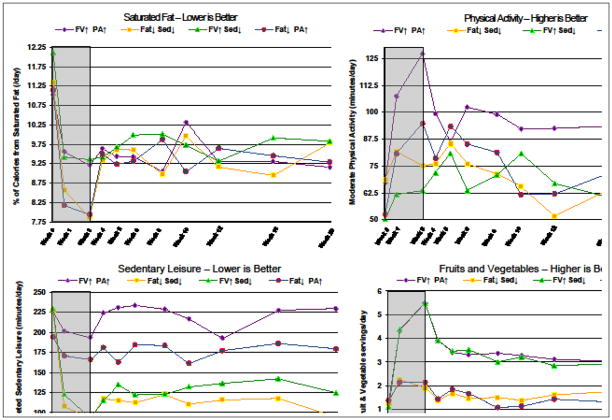
Figure 4.
Effects of the 4 Treatments on Changes Over Time in Each Behavior Expressed in Natural Units*
*Abbreviations: FV indicates fruits/vegetables; Fat indicates saturated fat; PA indicates physical activity; Sed indicates sedentary leisure. Gray background indicates treatment phase (weeks 0–3); white background indicates follow-up without treatment (weeks 4–20)

