Fig. 2.

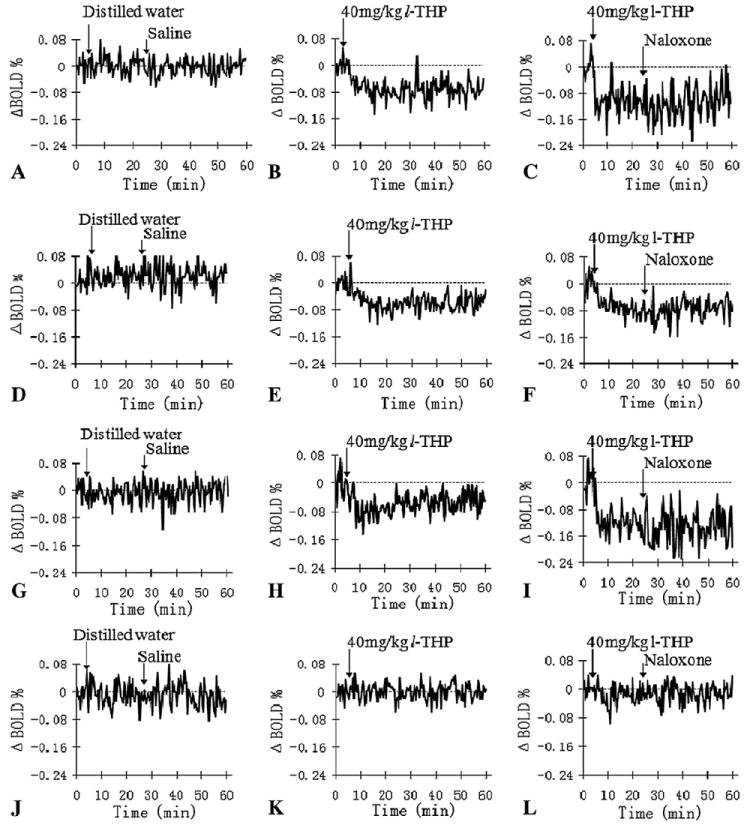
Representative relative voxel time course changes (ΔBOLD %) in regions of NAc (A–C), the IL (D–F), VTA (G–I) and Cl (J– L) after the vehicles, l-THP and naloxone infusions, respectively.

Representative relative voxel time course changes (ΔBOLD %) in regions of NAc (A–C), the IL (D–F), VTA (G–I) and Cl (J– L) after the vehicles, l-THP and naloxone infusions, respectively.