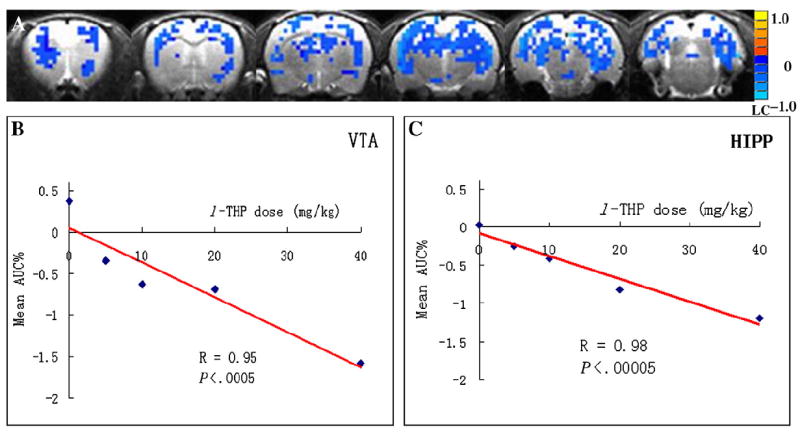
Fig. 4.

Linear correlation of l-THP doses and mean AUC% values. (A) The voxelwise linear regression maps of l-THP doses across the 16 rats. The regional mean AUC% values linearly correlated with l-THP doses in regions of VTA (B) and the HIPP (average for both left and right sides) (C).
