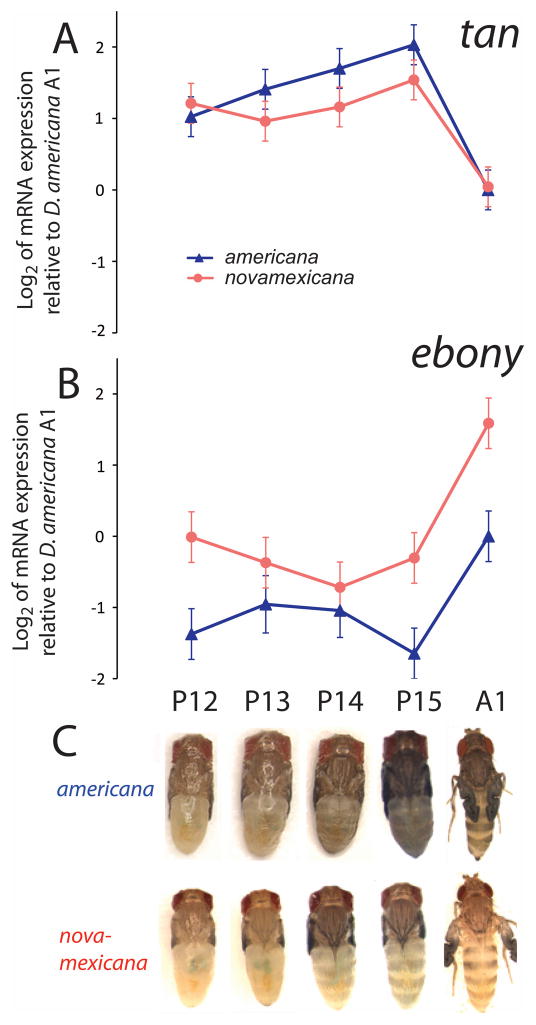
Figure 4. Total mRNA expression of tan and ebony differs over developmental time and between species.
The log2 of mRNA abundance at tan (A) and ebony (B) are shown for developmental stages P12 - A1 (C). Each point represents the mean of four log2-transformed biological replicates of either D. americana (blue) or D. novamexicana (red) mRNA expression, relative to D. americana stage A1. D.americana stage A1, the internal reference point, was arbitrarily assigned a log2 value of zero for both genes. Error bars are the experimentwise 95% confidence intervals, calculated separately for tan and ebony.

