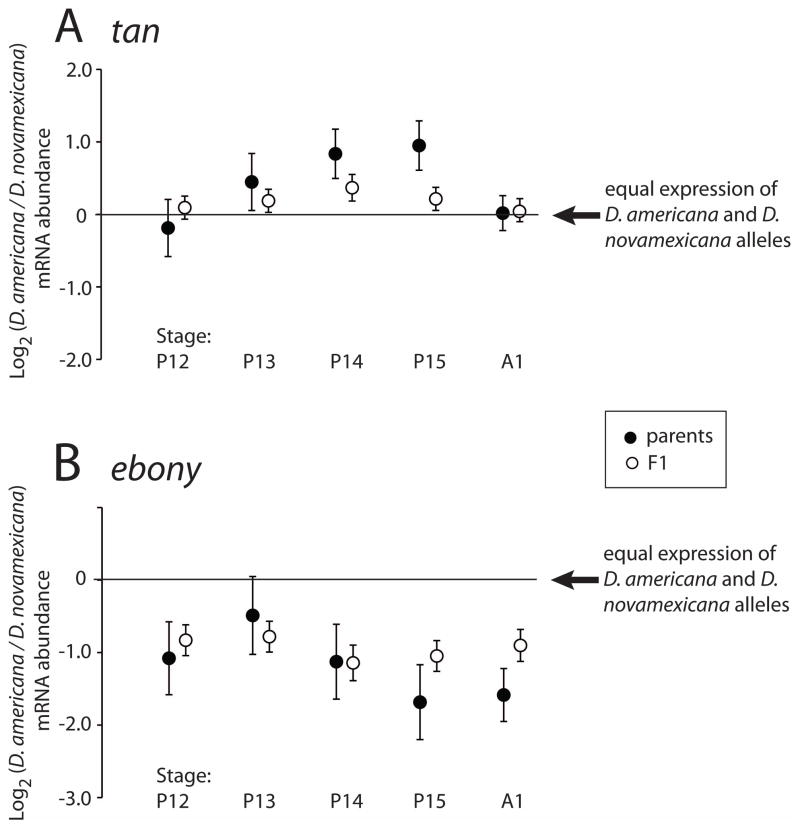
Figure 5. Species- and allele-specific differences in tan and ebony mRNA expression over developmental time.
The log2 of mRNA abundance at tan (A) and ebony (B) are shown for developmental stages P12 - A1 (x-axis). Filled circles represent the ratio of D. americana to D. novamexicana gene expression between the species (“parental data”). Open circles represent the ratio of expression of the two alleles within F1 hybrids. A value of 0 corresponds to no expression difference between the two alleles; alleles are significantly differentially expressed (P < 0.05) at all except stages P12 and A1 (both parental and F1 data) for tan, and stage P13 (parental data only) for ebony. Parental data were obtained using indirect comparisons for stages P12 and P13, and direct comparisons for stages P14 - A1. Each point shows the mean of four biological replicates. Error bars are experiment-wide 95% confidence intervals, calculated separately for each dataset (parental indirect; parental direct; and F1 hybrid).

