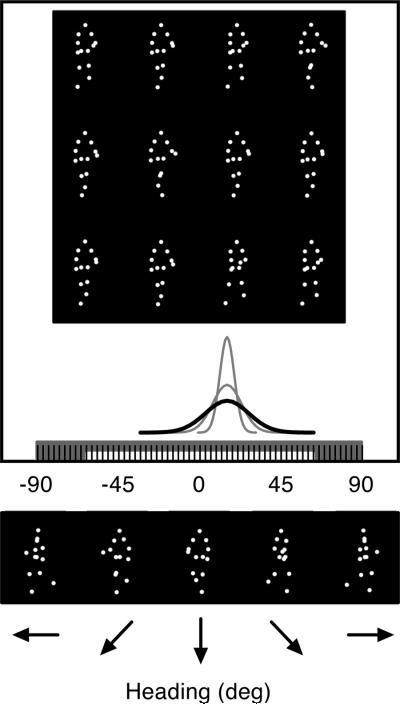
Fig. 3.
Crowd generation procedure. A heterogeneous crowd of walking people was generated by sampling 12 individual headings from a Gaussian distribution centered at one of 43 headings. The width of the distribution varied from narrow to wide (SDs = 0°, 2°, 4°, 6°, 8°, 10°, and 12°) to create seven levels of crowd variability. SDs of 4°, 8°, and 12° (in black) are shown. The white and gray bars along the x-axes indicate the range of possible crowd headings and individual headings, respectively.

