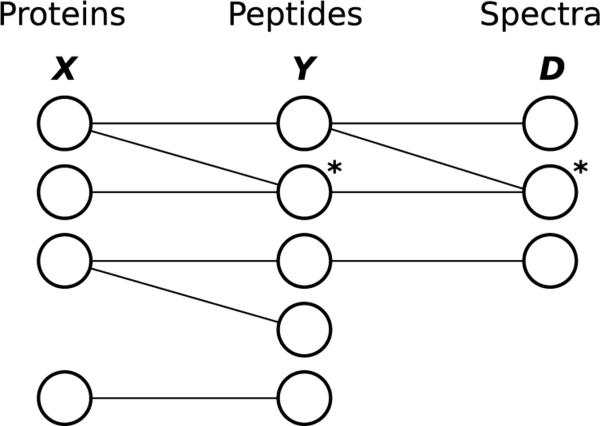
Figure 2. The general graphical view of dependencies in protein inference.
Proteins (X), peptides (Y), and spectra (D) form a tripartite graphGwith edges indicating well-established dependencies motivated by the mass spectrometry process. Examples of a degenerate peptide and a degenerate spectrum are labeled with asterisks. It is important to note that in the graphG, all proteins, peptides, and spectra are included, even those that are not connected to observed spectra.

