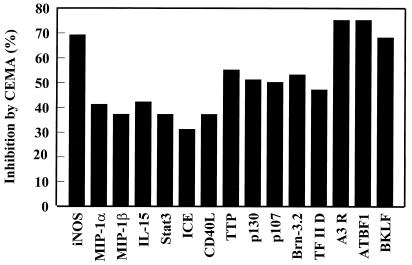
Figure 3.
Effect of CEMA on LPS-induced gene expression in RAW 264.7 cells. RAW 264.7 cells were stimulated for 4 h with media alone, S. typhimurium LPS (100 ng/ml), or S. typhimurium LPS (100 ng/ml) and CEMA (50 μg/ml). The RNA was isolated from the cells and used to make 32P-labeled cDNA probes, which were hybridized to the CLONTECH Atlas arrays, and after a 3-day exposure, they were analyzed with a Phosphorimager and CLONTECH atlas software. The average percent inhibition of gene transcription by CEMA as measured by a change in fold intensity is shown in the graph. The following selected genes are shown: iNOS, inducible nitric oxide synthase; MIP-2 α, macrophage inflammatory protein (chemokine); MIP-1 β, macrophage inflammatory protein (chemokine); IL-15, interleukin-15; (cytokine), Stat3, acute-phase response factor; ICE, interleukin-converting enzyme; CD40L, CD40 ligand; TTP, tristetraprolin: (destabilizes TNF mRNA); p130 and p107, retinoblastoma proteins; Brn-3.2 POU, transcription factor 1; TF II D, transcription factor; A3R, adenosine A3 receptor; ATBF1, AT motif-binding factor (transcription factor); BKLF, CACCC Box-binding transcription factor. Data are from M.G.S., C. M. Rosenberger, M. R. Gold, B. B. Finlay & R.E.W.H. (unpublished results).

