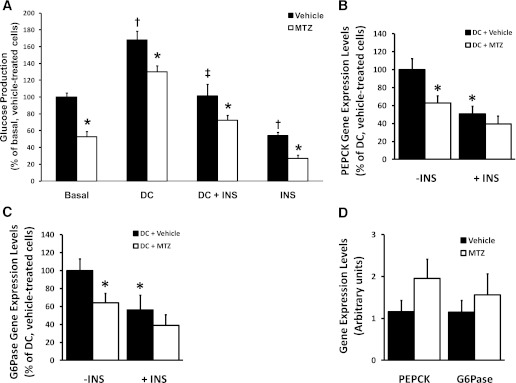
FIG. 3.
Methazolamide reduced glucose production from pyruvate in FAO hepatoma cells, and the effect on PEPCK and G6Pase gene expression levels in db/db mice livers and FAO cells. A: Glucose production by FAO hepatoma cells was determined 24 h after treatment with vehicle (0.33% DMSO, black bars) or 100 μmol/L MTZ (white bars). Treatments were conducted in basal conditions (Basal) or after glucose production was activated with 100 nmol/L dexamethasone and 100 μmol/L CPT-cAMP (DC) in the presence or absence of submaximal 0.1 nmol/L insulin (DC + INS or INS). Data are the mean percent of basal, vehicle-treated cells ± SE of ≥ 6 independent experiments, where each treatment within an experiment was performed in triplicate. The average amount of glucose produced by the basal, vehicle-treated FAO liver cells was 45.6 ± 17.9 μg glucose per mg protein (mean ± SD). *P ≤ 0.05 vs. corresponding vehicle-treated cells; †vs. basal, vehicle-treated cells; ‡vs. DC, vehicle-treated cells. PEPCK (B) and glucose-6-phosphatase (G6Pase; C) mRNA levels in FAO hepatoma cells treated with 100 nmol/L dexamethasone and 100 μmol/L CPT-cAMP (DC) for 24 h to activate gluconeogenesis in absence (−INS) or the presence of 0.5 nmol/L insulin (+INS), 0.3% DMSO (+Vehicle), or 100 μmol/L methazolamide (+MTZ) are shown. Data are expressed as percent of the activated (DC-treated), non-MTZ treated cells from 3 to 5 independent experiments, where each treatment within an experiment was performed in triplicate. *P < 0.05 vs. DC, vehicle (noninsulin or MTZ) treatment group. D: PEPCK and G6Pase mRNA levels in livers of db/db mice treated with vehicle (35% PEG400) or 50 mg/kg MTZ for 14 days. Data represent the means ± SE of 6 mice per group.

