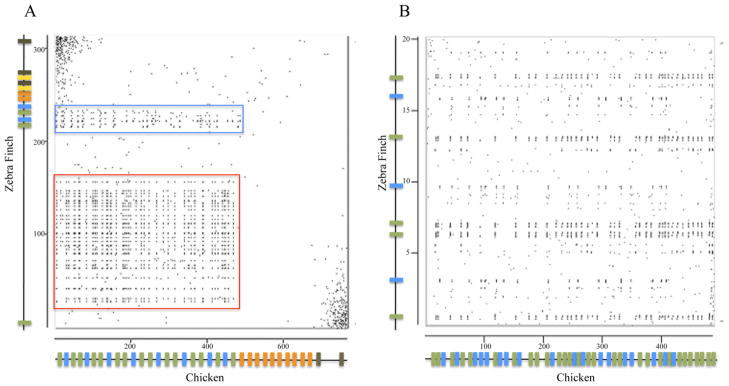
Figure 3.
Dot plot comparison between zebra finch and chicken TCRα/δ loci. A. Dot plot analysis of 314kb region containing the zebra finch TCRα/δ locus (vertical axis) compared to 767kb region that contains the chicken TCRα/δ locus (horizontal axis). Approximate TCR gene locations are shown as colored bars on each axis. Genes are color coded as in figure 1. The red box indicates the regions that contain feather β-keratin genes. The blue box is shown in greater detail in 3B. B. Dot plot analysis of zebra finch (20kb) and chicken (485kb) regions that contains Vα1 and Vα2 subgroups. Genomic sequences were compared using the Spin program of Staden Package (staden.sourceforge.net).

