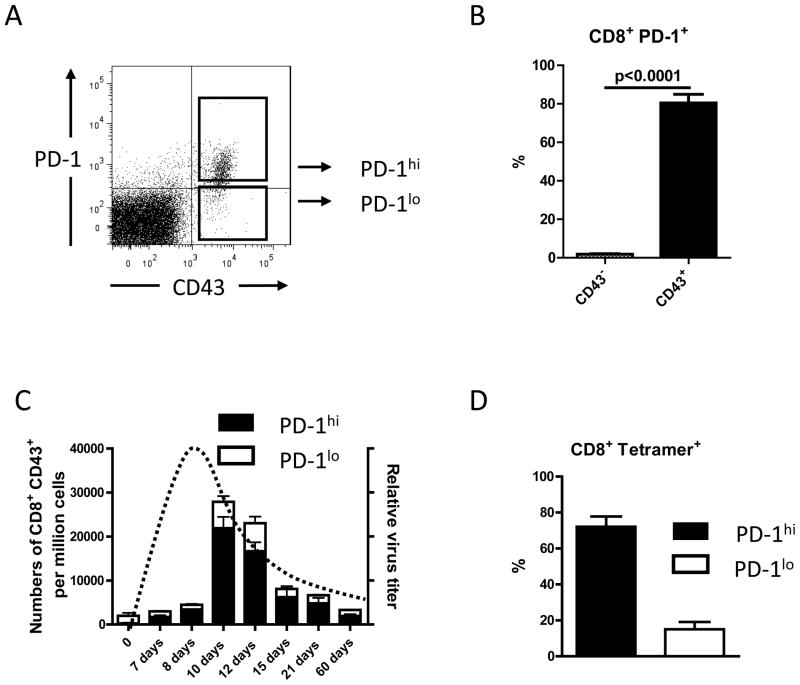
Figure 1. Expression of PD-1 on activated CD8+ T cells during acute FV infection.
CD8+ T cells from FV infected B6 mice were stained for the activation-associated glycoform of CD43 and PD-1 to detect the expression of PD-1 on the total population of activated CD8+ T cells at different time points after FV infection. CD8+ T cells positive for CD43 during acute FV infection expressed several other effector T cell markers, like CD44 and CD69, and were negative for CD62L (data not shown (23)).
A. A representative dot plot shows how gated CD8 T cells were stained for the activation-associated glycoform of CD43 and PD-1 to analyze the two different populations of activated CD8+ T cells. B. The percentages of PD-1 positive CD8+ T cells expressing the activation marker CD43 (black bar) or were CD43 negative (white bar) are shown for a group of 6 – 10 mice on day 10 post FV infection. Data were pooled from two independent experiments with similar results. Each column represents the mean percentage plus SEM. Statistically significant differences between the groups are indicated by a P value. C. Kinetic analysis of the expansion of activated (CD43+) CD8+ T cells and their relative expression of PD-1 (hi=high; lo=low). Each column represents mean numbers of CD43+ CD8+ T cells per one million nucleated cells for a group of 6 – 10 mice. Black bars show the numbers of PD-1hi CD43+ CD8+ cells plus SEM and white bars show numbers of PD-1lo CD8+ CD43+ T cells plus SEM. Data were pooled from two independent experiments with similar results. The kinetics of the relative virus titer is indicated by a dotted line. D. The percentages of DbGagL class I tetramer reactive virus-specific CD8+ T cells, which were PD-1hi (black bar) or PD-1lo (white bar) are shown for a group of 5 – 10 mice on day 10 post FV infection. Data were pooled from two independent experiments with similar results. Each column represents the mean percentage plus SEM of CD8+ tetramer+ T cells.

