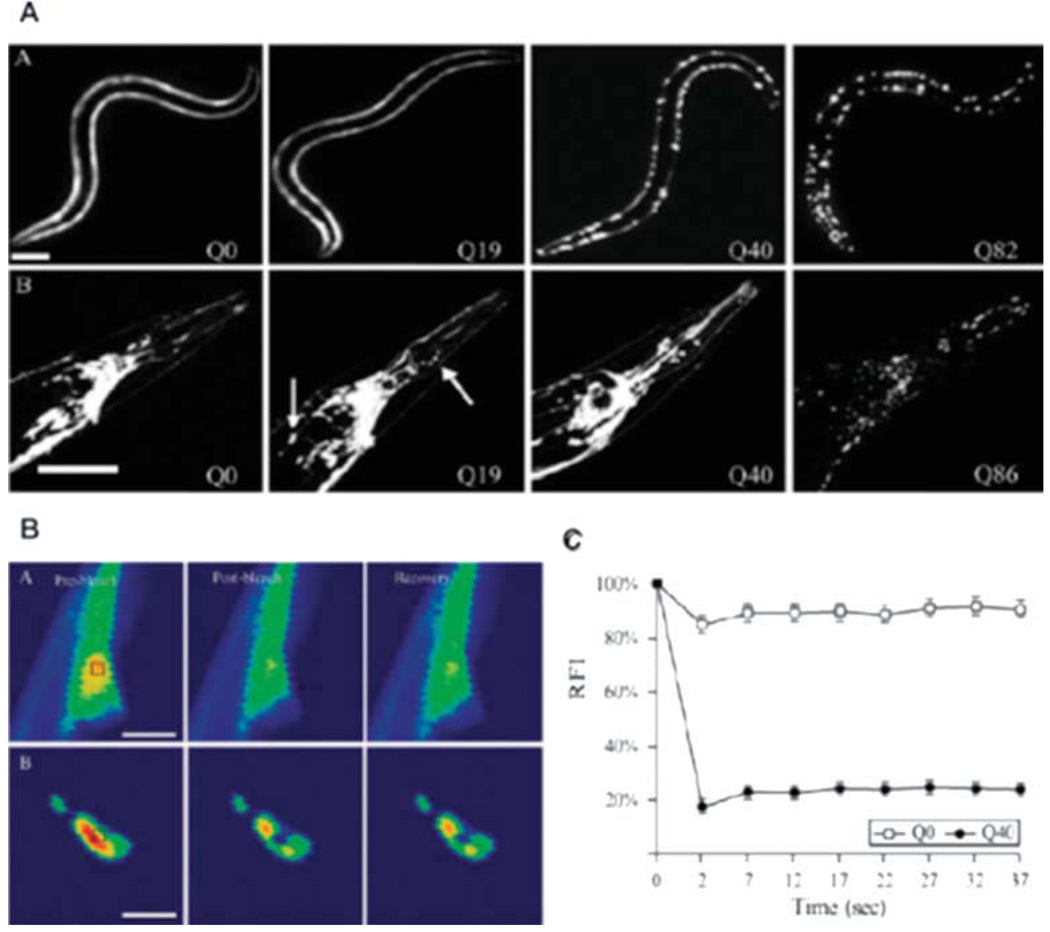
Fig. 2.
C. elegans polyglutamine model. A: Expression of polyQ in the body wall muscle (Punc-54Q(n)::YFP; top) and throughout the nervous system (PF25B3.3Q(n)::CFP; bottom). The expression of both models shows a polyQ length-dependent aggregation pattern. B: FRAP analysis of poly- Q::YFP in body wall muscle cells to analyze solubility of polyQ proteins. Images are taken before bleaching (pre-bleach, left), immediately after bleaching (post-bleach, middle), and after a recovery period (recovery, right). Q0::YFP recovers rapidly and is soluble, whereas Q40::YFP foci do not recover and are immobile. C: Quantification of FRAP results. The graphs show the relative fluorescence intensity (RFI) for each time point (Brignull et al., 2006b).

