
Figure 2.
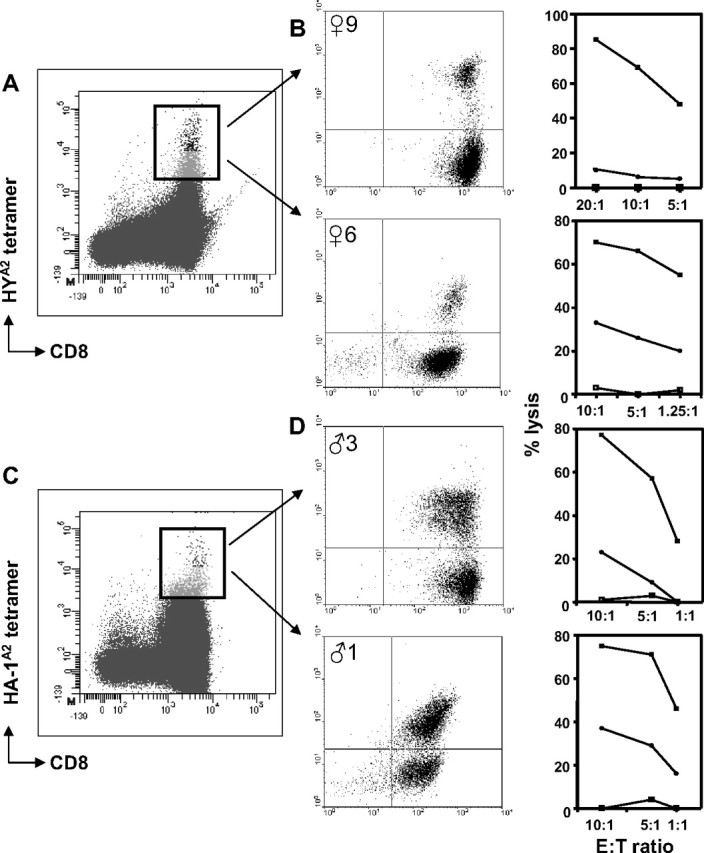
Tetramer staining patterns and cytolytic function of CD8+ minor H antigen–specific T cells obtained from healthy women and men. (A,C) Representative tetramer-binding profiles of HY-specific T cells (A) and HA-1–specific T cells (C) detected ex vivo in CD8-enriched PBMCs after nonstringent FACS sorting. The rectangle indicates the total tetramer+ population isolated during a second round of FACS sorting. (B,D) The cytolytic activity, indicated as percentage lysis on the y-axis, of polyclonally expanded tetramer+ fractions tested against various target cells: □ indicates HLA-A2+, HA-1− female target cells; ■, HLA-A2+, HA-1− female target cells pulsed with HY peptide (B) or HLA-A2+, HA-1− female target cells pulsed with HA-1 peptide (D); and ●, HLA-A2+ HA-1+ male target cells. The effector:target cell ratios (as depicted on the x-axis) were calculated according to the corresponding percentage of HYA2 tetramer-binding T cells as shown in the center plots.