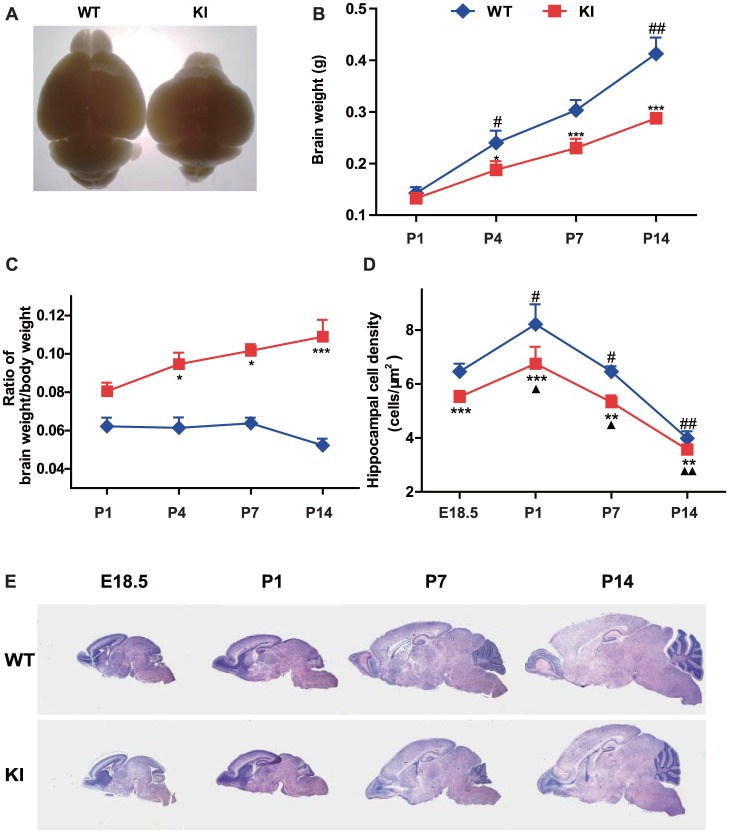
Figure 1. PTHrP NLS and C terminus deficiency leads to abnormal brain shape and structures.
(A) Representative graphs of brains from postnatal day 14 (P14) wild-type (WT) and Pthrp KI mice. Measurements on postnatal day 1 (P1), day 4 (P4), day 7 (P7) and day 14 (P14) in wild-type (WT) and Pthrp KI mice of (B) the brain weight, (C) the ratios of brain weight to body weight, and (D) the hippocampal cell density. (E) Representative micrographs from WT and Pthrp KI mice of HE stained sagittal sections of brains from embryonic day 18.5 (E18.5), P1, P7 and P14 (magnification, ×12.5). Each value is the mean±SEM of determinations in 5 mice of each group. *, P<0.05; **, P<0.01; ***, P<0.001 in Pthrp KI mice relative to wild-type littermates. #, P<0.05; ##, P<0.01 at the time point relative to the prior observed time point in WT mice. ▴, P<0.05; ▴▴, P<0.01 at the time point relative to the prior observed time point in Pthrp KI mice.

