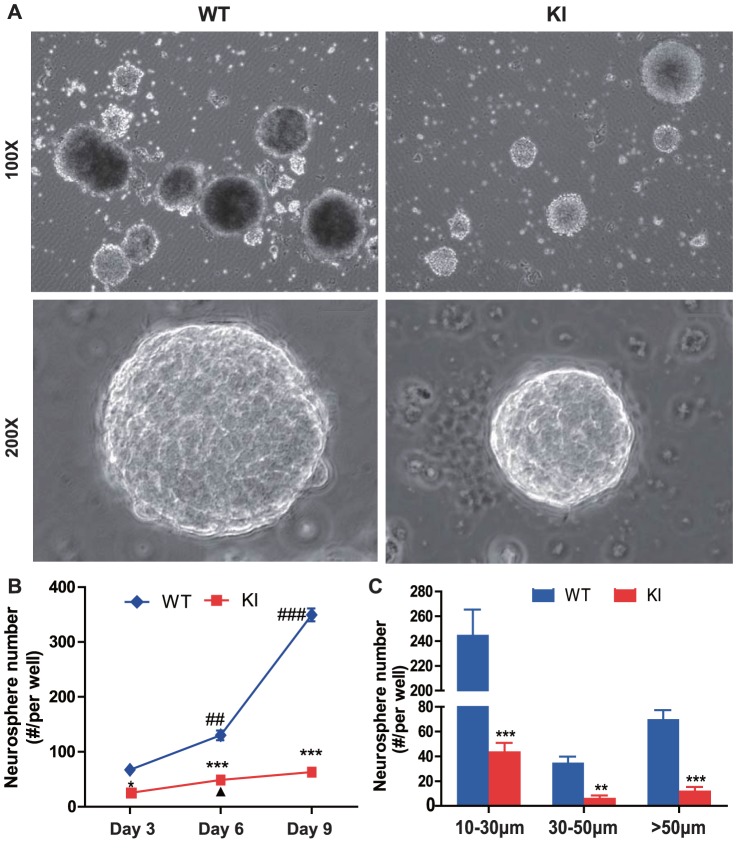
Figure 3. PTHrP NLS and C terminus deficiency results in a reduction of neurosphere forming efficiency.
(A) Representative micrographs of neurospheres developed from the neurosphere assay of WT and KI mice. (B) Neurosphere numbers per well developed from 3, 6 and 9 day cultures. (C) Neurosphere numbers per well at different sizes developed from 9 day cultures. *, P<0.05; **, P<0.01; ***, P<0.001 in Pthrp KI mice relative to wild-type littermates. ##, P<0.01; ###, P<0.001 at the time point relative to the prior observed time point in WT mice. ▴, P<0.05 at the time point relative to the prior observed time point in Pthrp KI mice.

