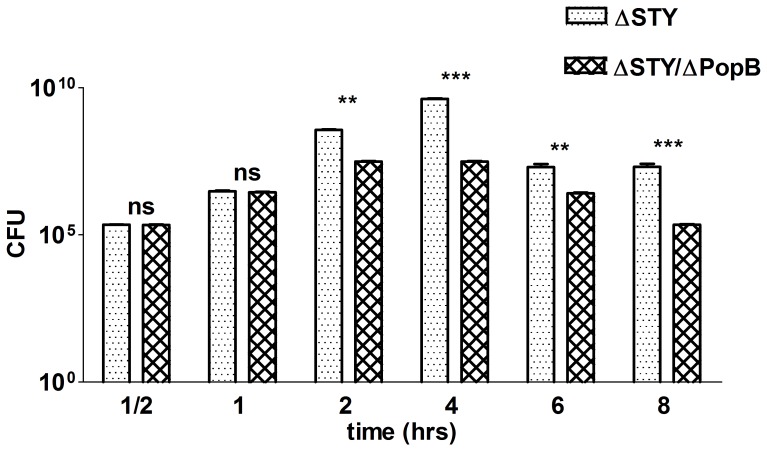
Figure 2. Bacterial load in the lungs of mice infected with different P. aeruginosa T3SS mutants.
C57BL/6 mice were infected intratracheally with 1.16 cfu of P. aeruginosa of the ΔSTY or ΔSTY/ΔPopB mutant strain. Bacterial load was determined by counting at different time points post infection (PI) the number of viable bacteria in lung homogenates. Lung homogenates were diluted serially with sterile water and placed on LB agar plates for 24 h at 37°C (n = 6 mice per group; NI = non-infected). Bars show means and standard deviations (SD) and are representative of 3 independent experiments. **0.001≤P≤0.01; ***P≤0.001; ns = not significant.

