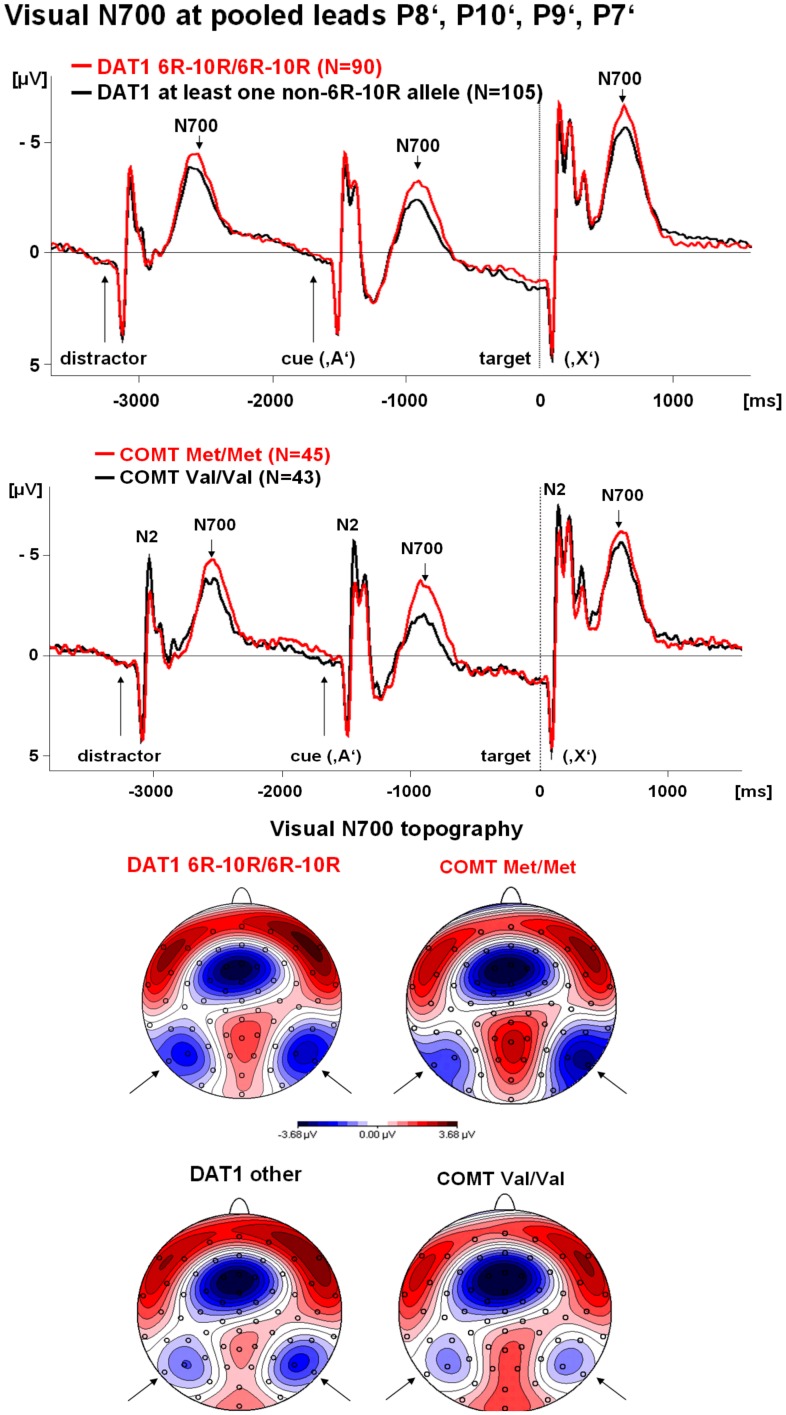
Figure 1. Time course and topography of the early visual contingent negative variation (CNV) by DAT1 and COMT polymorphisms separately.
Top: Time course by a) DAT1 haplotype, and b) COMT Val158Met genotype. Negativity is indicated by upward deflections. Stimulus-locked averages are displayed, the vertical dashed line indicates the time of the button press. The visual post-processing interval is selectively and reliably affected. Only the COMT polymorphism seems to influence the visual N2 in the opposite direction to the visual early CNV. Bottom: Topography of the early CNV (600–900 ms after the cue ‘A’). Isopotential line maps are shown, negativity is illustrated by blue areas, positivity by red areas. The head is viewed from above, the nose is upwards. The small circles illustrate the position of the electrodes. Arrows mark the visual early CNV maximum. The topography appears to be unaltered by DAT1 and COMT polymorphisms, but occipito-temporal early CNV amplitude is increased in the subjects with the Met/Met and the 6R–10R/6R–10R genotypes.

