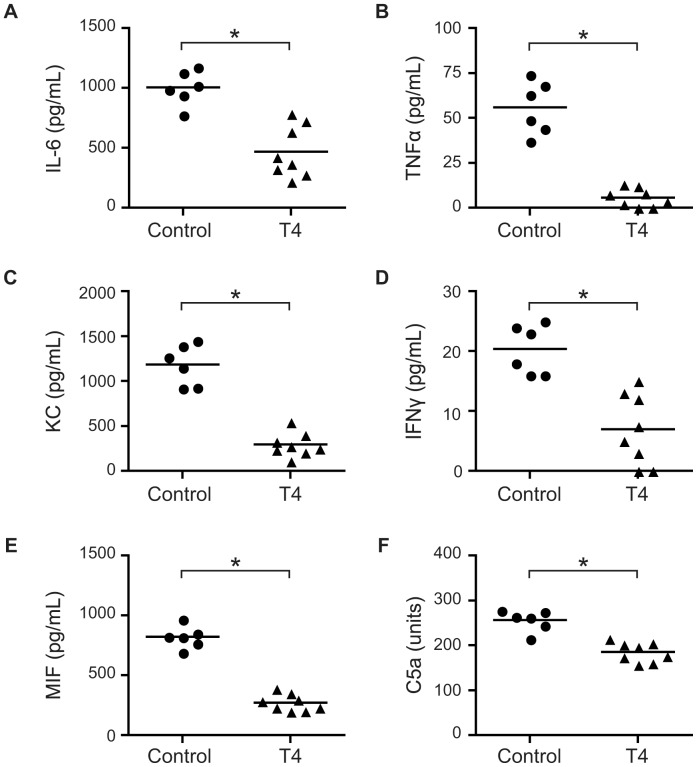
Figure 2. T4 attenuates inflammatory responses in vivo.
Mice (n = 8 per group) were treated as described in Figure 1 and the concentrations of IL-6 (A), TNFα (B), KC (C), IFNγ (D), MIF (E) and C5a (F) in serum at 24 h p.i. were measured by ELISA. Symbols represent individual mice and the horizontal lines represent mean of the values. *, P<0.05 (Student’s t-test).

