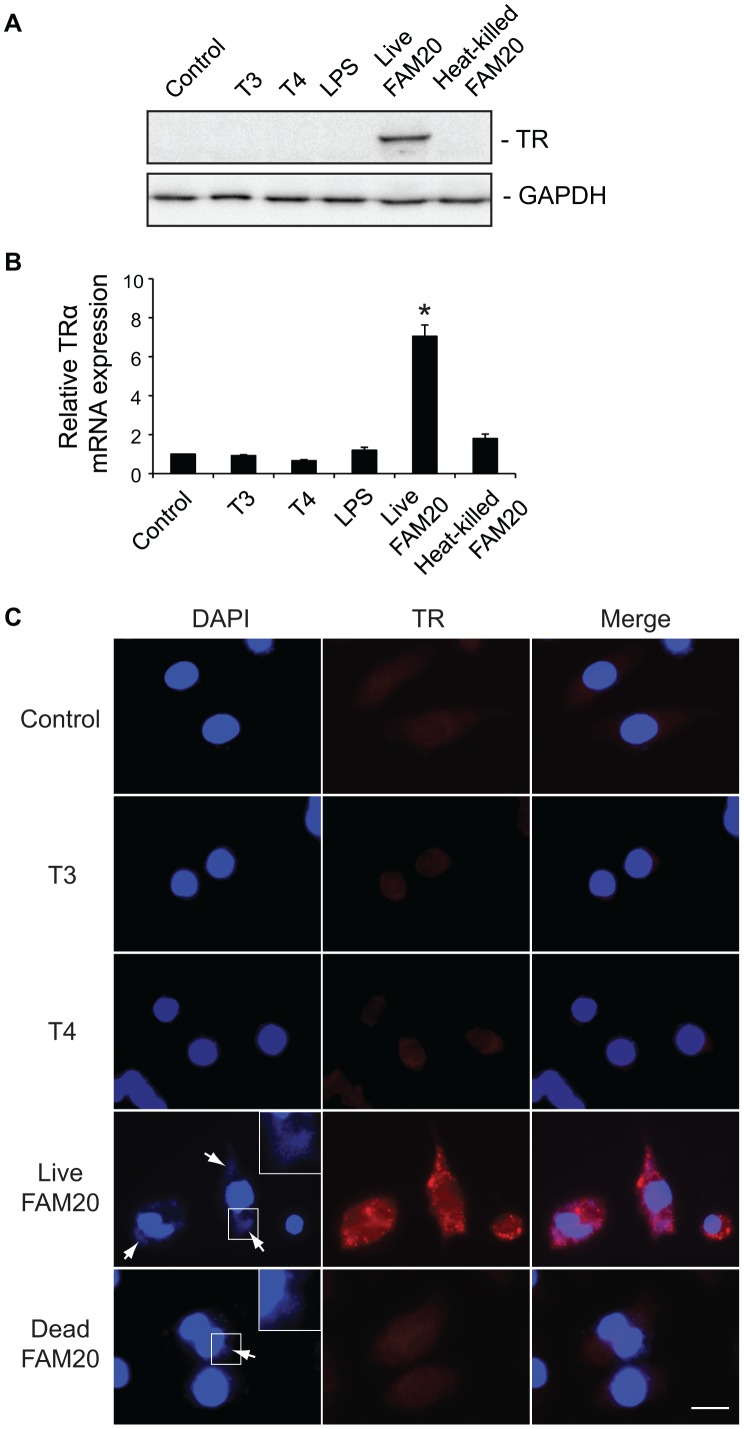
Figure 7. Expression of TRα in macrophages is induced by live N. meningitidis.
RAW264.7 cells were treated with T3 (100 nM), T4 (1 µM), LPS (500 ng/ml), live FAM20 (MOI = 2) or heat-killed FAM20 (MOI = 200) for 24 h. (A) Expression of TRα in cells was detected by Western blot using an anti-TRα/β Ab. Expression of GAPDH was measured as a loading control. (B) Levels of TRα mRNA were analyzed by real-time PCR. Expression levels were normalized to a reference mRNA (GAPDH). The experiment was performed in triplicate and results are presented as means ±SD. *, P<0.05 (Student’s t-test). (C) Expression and localization of TR in macrophages was visualized by immunofluorescence staining using an anti-TRα/β Ab. Cell nuclei and bacteria (arrows) were stained with DAPI. Representative images are shown from experiments that were repeated three times. Scale bar: 10 µm.

