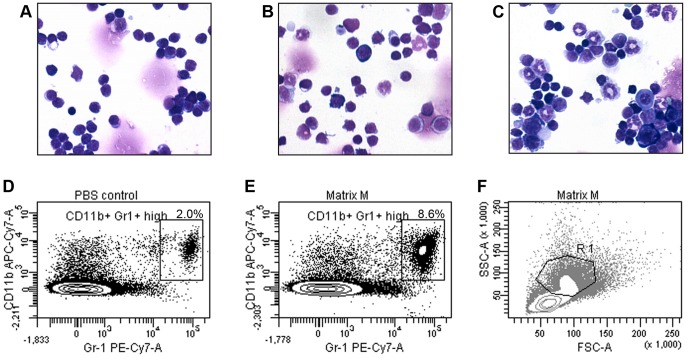
Figure 5. Characterization of splenocytes after Matrix-M™ treatment.
Morphology of May-Grünwald-Giemsa stained splenocytes taken from a PBS-treated mouse (A), mice treated with 3 µg Matrix-M™ (B) or 30 µg Matrix-M™ (C) (original magnification X40). Representative dot plots of the CD11b+ Gr-1high population in spleen at 48 h after injection of PBS (D) or 30 µg Matrix-M™ (E). More than 90% of the cells in the CD11b+ Gr-1high gate can be found in the R1 region in FSC-SSC plot (F). Contour interval is 15%. M, Matrix-M™.

