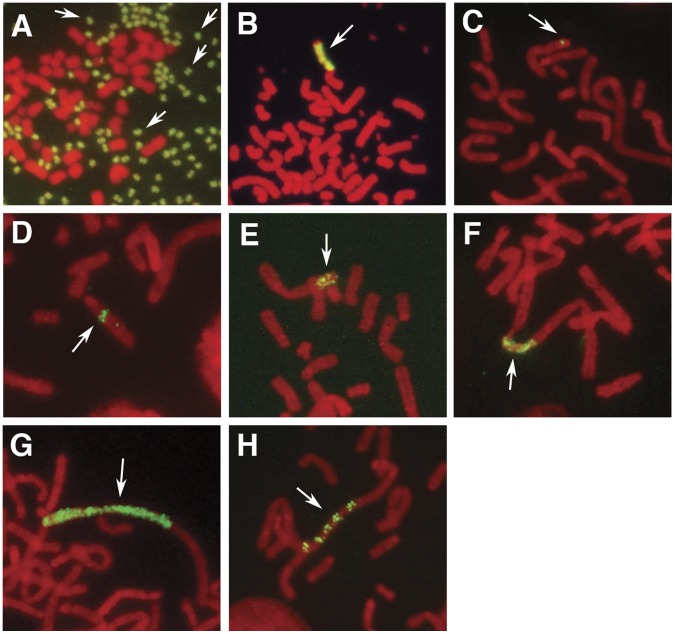
Figure 2. Generation of several kinds of amplified structures by the IR/MAR plasmid depending on the cell type.
The IR/MAR plasmid was transfected into cells, a stable transformant was selected by drug selection, and a metaphase chromosome spread was prepared. Green fluorescence indicates the plasmid sequence after FISH and red fluorescence indicates the chromosome after propidium iodide (PI) staining. Representative images of several types of gene amplification are shown. In COLO 320DM cells, the plasmid was usually amplified as extrachromosomal DMs (A) or an chromosomal homogeneous array of HSR (B). In CHO DG44 cells (C to H), the IR/MAR plasmid was amplified as a chromosomal structure of varying length, including a tiny dot (C), a line (D) and a HSR longer than the metaphase chromosome width (cw), which appeared as either a fine ladder (E to G) or a ladder (H) structure. For the definition of these structures, see the text. The frequencies of these structures were counted and shown in the graphs appearing in Figures 3 to 5 using the legend shown in panel I of this Figure.

