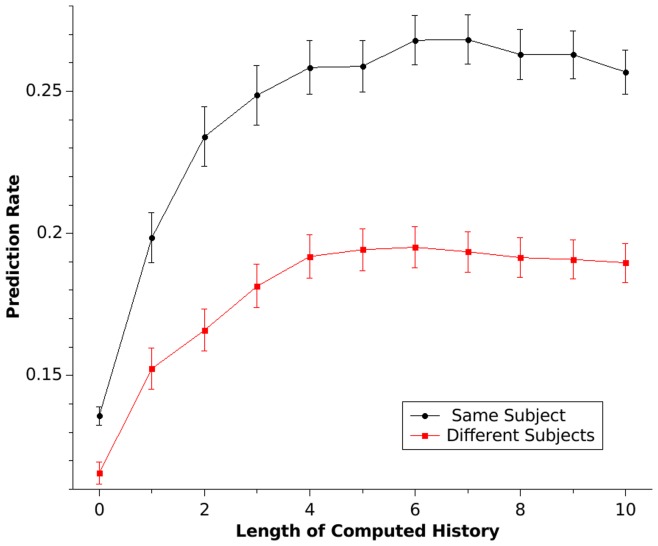
Figure 2. The prediction rate is shown as a function of the length of computed history (h).
The prediction rate for sequences from the same subject is shown in black; the predication rate for sequences of different subjects is shown in red. The predication rate increases with the length of the computed sequence history. As h increases, the next sequence element can be predicted more precisely and with a history of length h = 7, 27% correct predictions of same-subject sequences can be made (chance performance = 11%). Error bars represent SEM.

