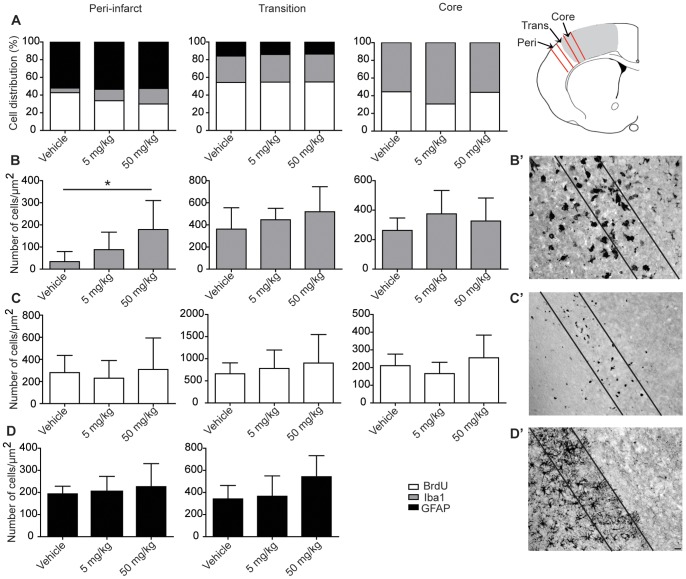
Figure 4. Cell proliferation and glial cell distribution determined by immunostaining 72 h after infarction.
The bar graphs (mean±SD) represent the cell distribution in the peri-infarct, transition and core regions A) the percentage of total cell number per region and B-D) the number of cells/µm2, B’) activated microglia (Iba1), C’) proliferating cells (BrdU) and D’) reactive astrocytes (GFAP). No GFAP positive cells were observed in the core region. Sulforaphane treatment only altered the microglial cell number in the peri-infarct region compared to vehicle treatment (F(2,15) = 4.76, p≤0.025) (n = 5–9 in each group, solid black box GFAP astrocytes, solid grey box Iba1 microglia, open box BrdU proliferating cells).

