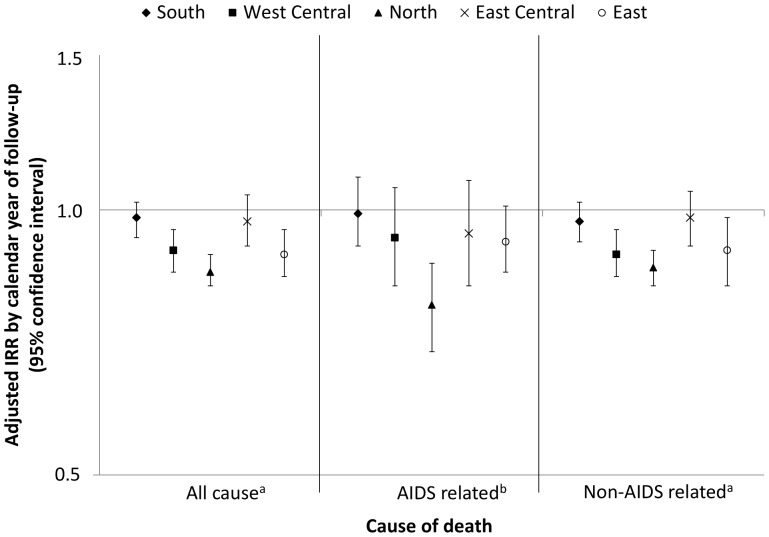
Figure 2. Incidence rate ratio (IRR) for all cause, AIDS and non-AIDS related mortality per calendar year of follow-up stratified by region.
(Argentina was excluded from this analysis due to limited power). aadjusted for gender, age*, HIV exposure group, hepatitis B* and C* status, prior AIDS diagnosis, prior non-AIDS diagnosis, hypertension*, diabetes*, anaemia*, smoking status*, CD4 count*, baseline date* and on cART viral load*. badjusted for gender, age*, HIV exposure group, hepatitis B* and C* status, prior AIDS diagnosis, prior non-AIDS diagnosis, hypertension*, diabetes*, anaemia*, CD4 count*, baseline date* and on cART viral load*. *time-updated.

