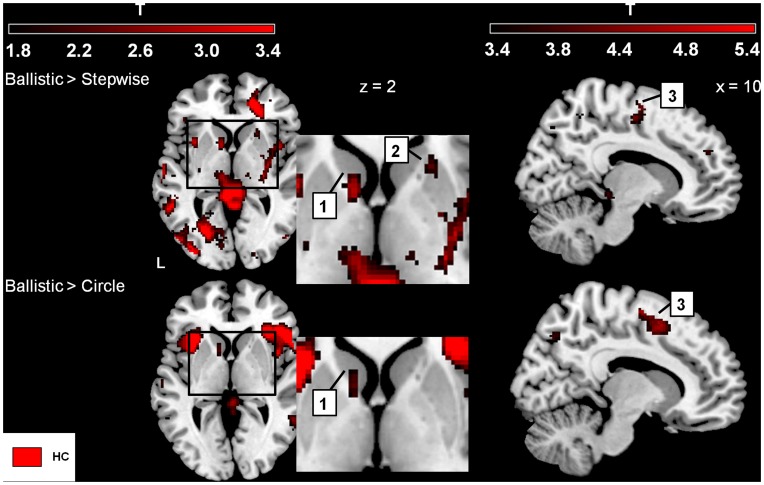
Figure 4. Ballistic initiation versus Stepwise and Circle, respectively (healthy subjects).
Increased activations (SPM-T maps) focusing on movement initiation. The color-coded bars at the top of the figure indicate t-map intensities (T = 2.4 corresponds to p = 0.01 (uncorrected)). 1 = caudate nucleus, 2 = (anterior) ventral putamen, 3 = supplementary motor area (SMA). Basal ganglia activation shown at z = 2 mm (the position of the transversal plane relative to the AC-PC plane) with a threshold p = 0.05 (uncorrected and extended voxel threshold of k = 30 voxels), and SMA activation is shown at a threshold p = 0.001 (uncorrected and extended voxel threshold k = 10) shown at x = 10 (position of parasagittal plane relative to the sagittal plane that divides left and right sides of the brain). Left side of the brain is marked ‘L’.

