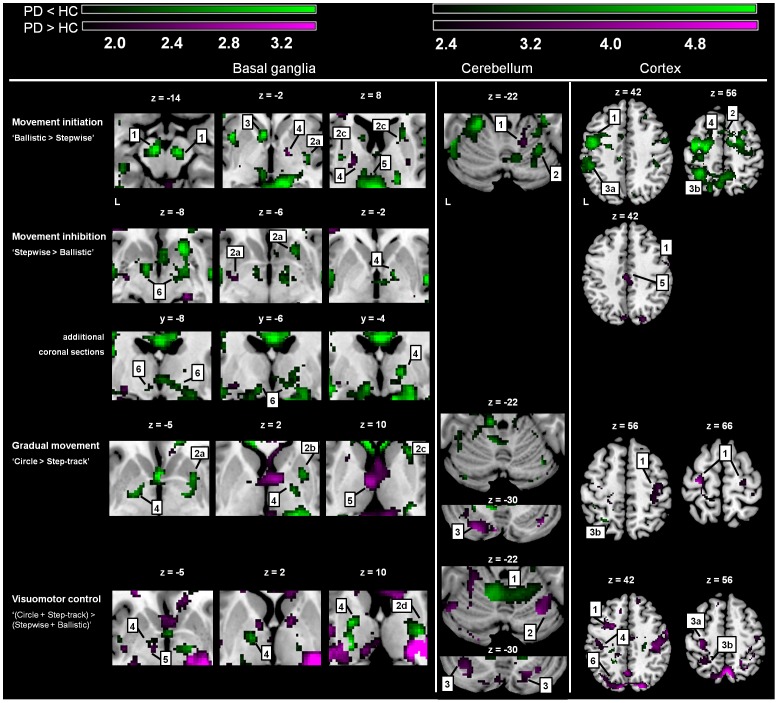
Figure 6. Differences in task-related activations between groups.
SPM T-maps of changed activations for three comparisons focused on abrupt movement initiation, movement inhibition and gradual movement modulation. The color-coded bars at the top of the figure indicate t-map intensities (T = 2.4 corresponds to p = 0.01 (uncorrected)). Foci of activation in green: Increased activations in Healthy Controls (HC) that did not occur in Parkinson’s Disease (PD), i.e. PD < HC, purple: PD > HC. Basal ganglia: 1 = substantia nigra, 2a = ventral putamen, 2b = medial putamen, 2c = dorsal anterior putamen, 2d = dorsal posterior putamen, 3 = caudate nucleus, 4 = pallidum, 5 = thalamus, 6 = subthalamic nucleus; Cerebellum: 1 = anterior cerebellum, 2 = posterior cerebellum, 3 = crus; Cortex: 1 = premotor cortex, 2 = supplementary motor area, 3a = inferior parietal cortex, 3b = superior parietal cortex, 4 = primary motor cortex 5 = cingulate gyrus, 6 = parieto-occipital sulcus. Differences in activations between groups were assessed by using exclusive masks (p = 0.05). For activations of the basal ganglia (BG) activations are shown above a threshold level of p = 0.05 (uncorrected and extended voxel threshold of k = 30 voxels), for the cerebellum/cortex activations are shown above threshold level p = 0.01 (uncorrected and extended voxel threshold of k = 10 voxels). The ‘z’ coordinates indicate the position of the transversal planes relative to the AC-PC plane. Activations were rendered on the standard anatomical (ch2) template of MRICron [53]. Left side of the brain is marked ‘L’.

