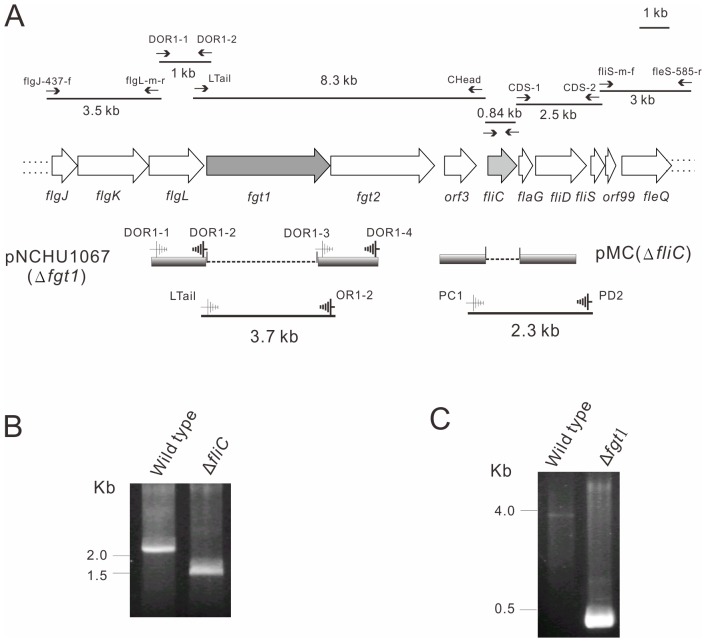
Figure 1. Cloning of flagellum gene cluster and glycosylation island and construction of fliC and fgt1 mutants.
(A) Organization of partial flagellum gene cluster and glycosylation island. The black lines represent the PCR fragments amplified by indicated primer pairs (see Table S1) as shown with arrows above the fragments. The constructs used to delete fliC and fgt1 genes are aligned below the gene structure. (B) fliC mutant was screened by PCR using primers PC1 and PD2 as indicated in Figure 1A. (C) fgt1 mutant was screened by PCR using primers prLTail and prOR1–2 as indicated in Figure 1A.

