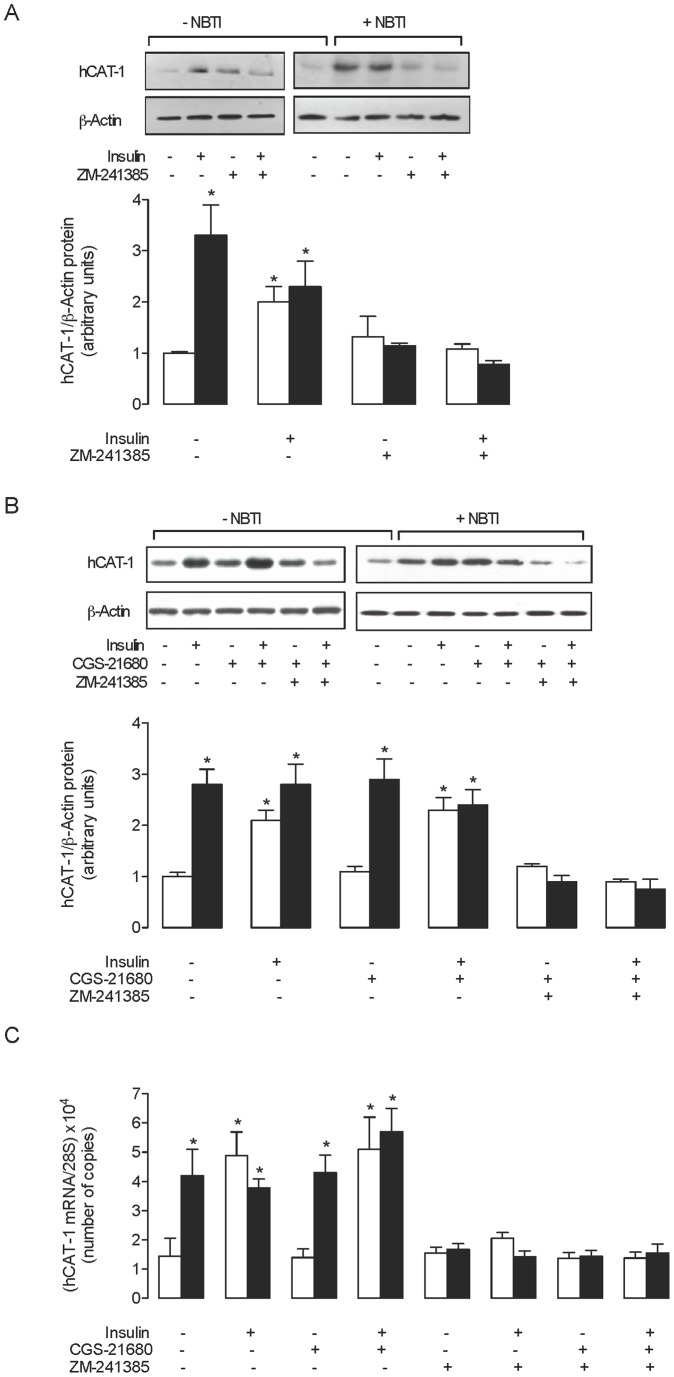
Figure 3. hCAT-1 protein abundance in response to insulin and adenosine receptor agonists and antagonists.
(a) Western blots (representative of other 16 experiments) for hCAT-1 in HUVECs incubated (8 hours) without (–NBTI) or with (+NBTI) 10 μmol/L nitrobenzylthioinosine (NBTI), in the absence (–) or presence (+) of 1 nmol/L insulin and/or ZM-241385 (10 nmol/L) (ß-actin is internal control). Lower panel: hCAT-1/ß-actin ratio densitometries from data in absence (white bars) or presence (black bars) of NBTI, normalized to 1 in cells in the absence of NBTI, insulin and ZM-241385 (control). (b) Western blots for hCAT-1 in the absence or presence of insulin, CGS-21680 and/or ZM-241385 as in (a). Lower panel: hCAT-1/ß-actin ratio densitometries from data in absence (white bars) or presence (black bars) of NBTI normalized to 1 in cells in absence of NBTI, insulin, CGS-21680 and ZM-241385 (control). (c) hCAT-1 mRNA expression relative to 28S rRNA (internal reference) as in (a) and (b). *P<0.05 versus values in control. Values are mean ± SEM (n = 16).

