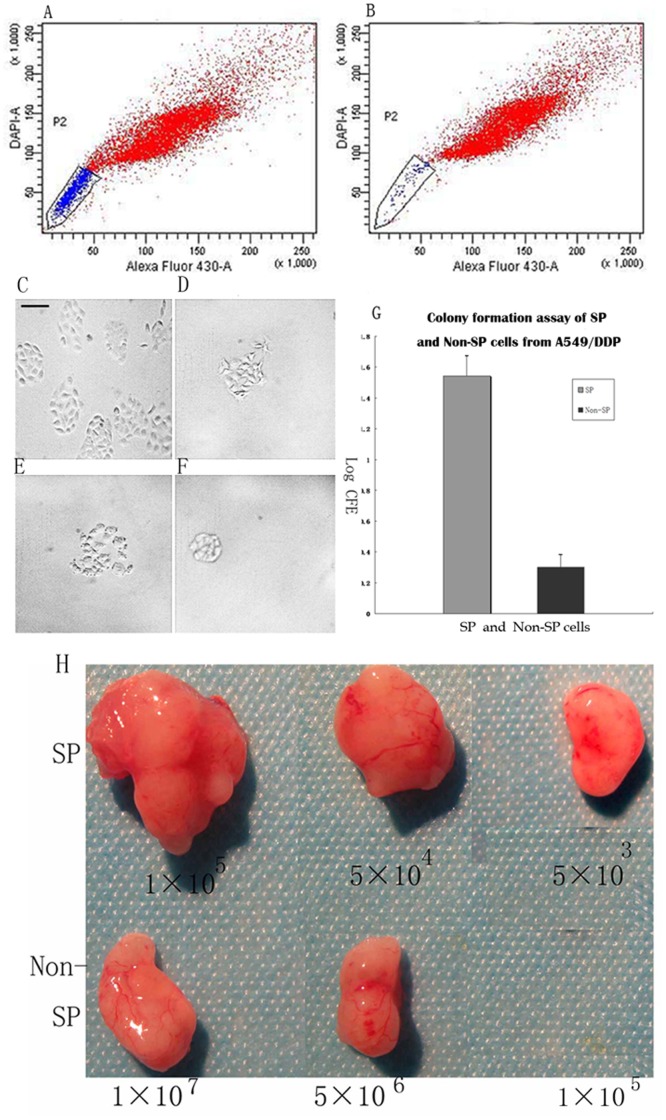
Figure 1. A549/DDP side population (SP) sorting and SP characters analysis.
(A) A549/DDP cells incubated with Hoechst 33342, without verapamil, and the boxed region indicates the SP on FACS. (B) A549/DDP cells incubated with Hoechst 33342 in the presence of verapamil, a control to identify the SP region on FACS. Representative micrographs of A549/DDP colonies formed after 10 days from (C) SP cells and (D) non-SP cells grown in serum-free medium and (E) SP cells (F) non-SP cells treated with LMWH, scale bar = 50 µm. (G) Log colony forming efficiencies (CFE) of SP and non-SP cells grown in serum-free medium, p<0.05. (H) Tumors formed after inoculation of different numbers of A549/DDP side population (SP) and non-SP cells in NOD/SCID mice after 14 days.

