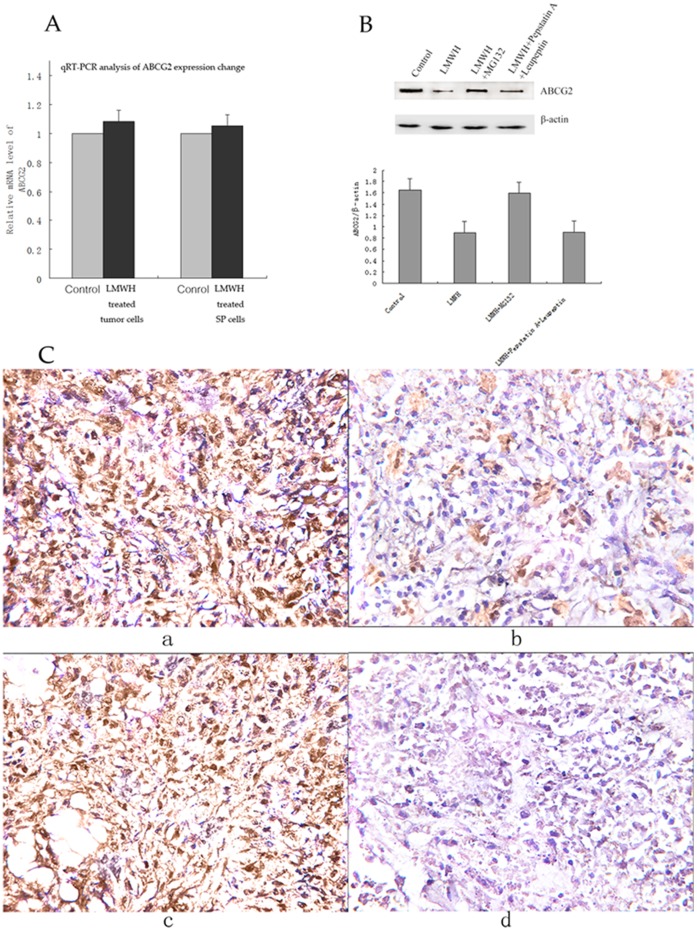
Figure 4. ABCG2 expression analysis with quantitative real time RT-PCR, western blot and immunohistochemistry staining.
(A) ABCG2 mRNA expression changes in LMWH treated tumor cells and LMWH treated SP cells. Quantitative real time RT-PCR shows that the expressions of ABCG2 mRNA were not significantly changed in LMWH treated tumor cells or LMWH treated SP cells compared with those in controls (p>0.05). β-actin was used as an internal reference. (B) Western blot analysis of ABCG2 expressions in SP cells treated with LMWH, LMWH+MG123, LMWH+Pepstatin A+Leupeptin, and control. SP cells were initially treated with LMWH or control for 10 hours, and then MG132 (10 µM), Pepstain A + Leupeptin (each 100 µg/ml), or control were added correspondingly and incubated for 6 hours. Then cells were harvested for western blot analysis. β-actin was used as a loading control. The densities of the ABCG2 protein bands in western blot were quantified with the Quantity One-4.6.2 program. (C) ABCG2 expressions in LMWH treated and control tumor tissues (IHC, SP×200). The average SI score of ABCG2 expression in LMWH treated tumor tissues was 3.63 compared with the average SI score of 9.13 in control tumor tissues (3.63±1.69 vs 9.13±2.03, p<0.05).

