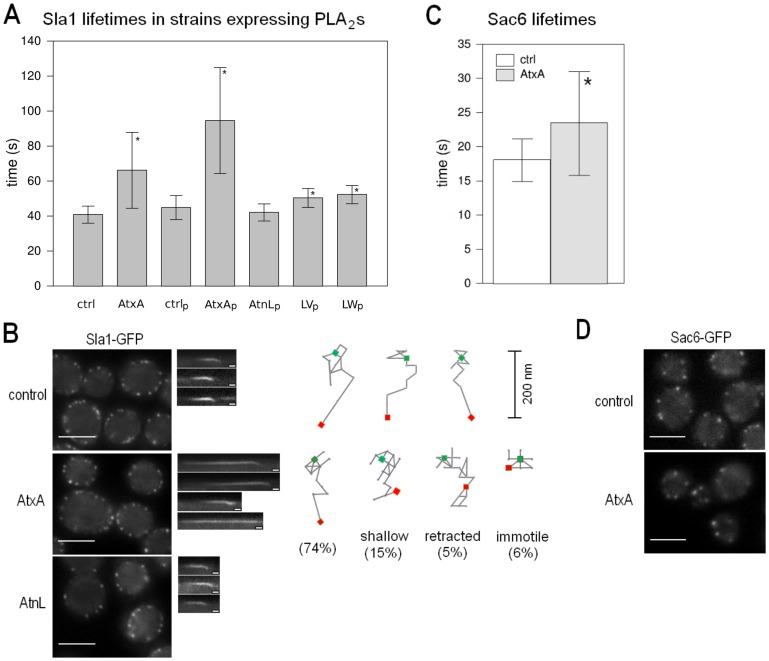
Figure 1. AtxA affects the dynamics of endocytic vesicle formation.
A Average Sla1-GFP patch lifetimes in the wild-type, and cells expressing AtxA, AtnL, and the LV and LW mutants of AtnL. B Analysis of Sla1-GFP dynamics. In the left panels, localizations of Sla1-GFP in the wild-type, AtxA-expressing and AtnL-expressing strains are shown. In the middle panels, representative kymographs are shown. For the AtxA-expressing strain, kymographs for a normally internalized, shallow internalized, retracted and immotile patch are shown. All kymographs are oriented such that the cell interior faces downwards. In the right panels the trackings of three Sla1-GFP patches from the wild-type cells and four patches from AtxA-expressing cells representing one normally internalized, shallow internalized, retracted and immotile patch each, are shown. Noted is also the percentage of their occurrence in the population. For each frame of the movie, the center of the patch was determined. Green rectangles denote the initial position and red rectangles the final position of the patches. Consecutive positions are connected with lines. All traces are oriented with the cell interior facing down. C Average patch lifetime of Sac6-GFP in a strain expressing AtxA from plasmid and corresponding control strain. D Localization of Sac6-GFP in a strain expressing AtxA from plasmid and corresponding control cells. Ctrl – control strain for the integrated AtxA, AtxA – strain expressing AtxA from singe copy integrated in the genome, ctrlp – control strain with empty plasmid, AtxAp, AtnLp, LVp and LWp – strains expressing the respective proteins from plasmid clones. To determine the average patch lifetimes at least 100 patches from several cells were analyzed unless otherwise noted. The bars on graphs mark the standard deviation. Sla1-GFP movies were taken with a 1 frame/second interval and Sac6-GFP movies with a 4 frames/second interval. Scale bar on the micrographs is 4 µm and on the kymographs 10 seconds. sPLA2-expressing strains were compared to the corresponding control strains, and p-values were calculated using the t-test at a 95% confidence interval. Statistically significant differences are denoted with a star (*).

