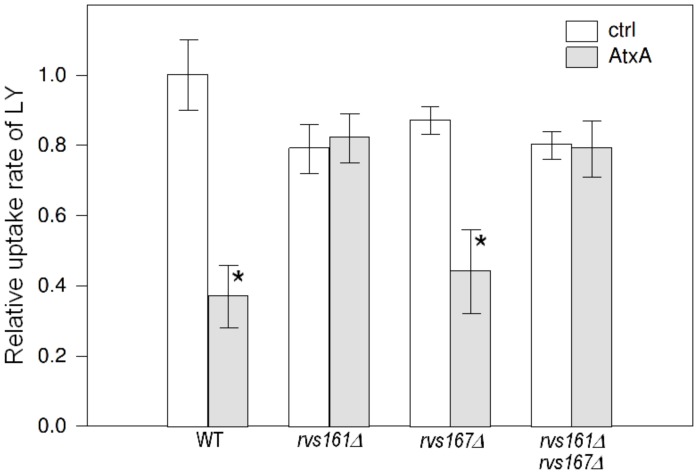
Figure 3. AtxA inhibits endocytosis in an Rvs161-dependent manner.
Relative uptake rates of LY in AtxA-expressing and control strains with wild-type and different rvs deletion backgrounds. The bars represent standard deviations of at least three independent measurements. AtxA-expressing strains were compared to the corresponding control strains, and p-values were calculated using the t-test at a 95% confidence interval. Statistically significant differences are denoted with a star (*).

