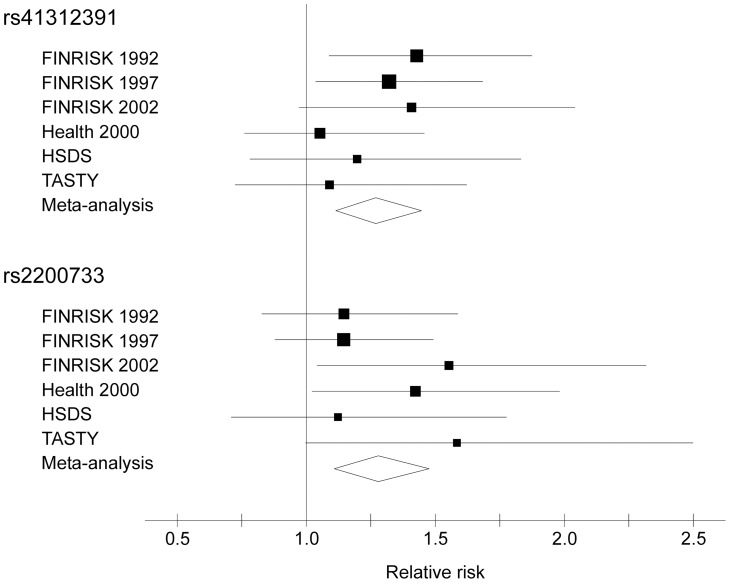
Figure 1. Forest plot of SCD risk ratios for rs41312391 and rs2200733.
The figure shows point estimates for relative SCD risk (squares, area proportional to the inverse-variance weight) and 95% confidence intervals (horizontal lines) in all six cohorts, adjusting for sex and geographic region. The lateral tips of the diamonds indicate the 95% confidence intervals for the relative risk and the widest point of the diamond the relative risk estimate in the meta-analysis. HSDS = The Helsinki Sudden Death Study, SCD = sudden cardiac death, TASTY = The Tampere Autopsy Study.

